100% tevredenheidsgarantie Direct beschikbaar na betaling Zowel online als in PDF Je zit nergens aan vast
logo-home
Summary Introduction to Statistics (Book Notes) €7,49
In winkelwagen

Samenvatting

Summary Introduction to Statistics (Book Notes)

 26 keer bekeken  1 keer verkocht

Notes on all chapters from the book "Statistics for the Behavioral Sciences (10th Edition)" for the course Introduction to Statistics.

Voorbeeld 4 van de 102  pagina's

  • Ja
  • 23 februari 2024
  • 102
  • 2021/2022
  • Samenvatting
book image

Titel boek:

Auteur(s):

  • Uitgave:
  • ISBN:
  • Druk:
Alle documenten voor dit vak (7)
avatar-seller
anniedeshkova
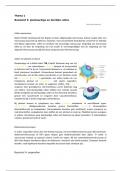
INTRODUCTION TO STATISTICS
CHAPTER 1 – Introduction to Statistics
1. Statistics, science, observations
1.1 definitions
 statistics consist of facts and figures
- informative and time-saving
- condense large quantities of information into simple figures
- the term “statistics” refers to a general field of mathematics
- statistics is a shortened version of “statistical procedures”
- research involves gathering information
 statistics serve two general purposes:
1) to organize and summarize information, so that the researcher can
see what happened in the research study and can communicate the
results to others
2) to help the researcher answer the questions that initiated the
research by determining exactly what general conclusions are justified
based on the specific results that were obtained
 statistics – refer to a set of mathematical procedures for organizing,
summarizing and interpreting information
 statistical procedures help ensure that the information is/observations
are presented and interpreted in an accurate and informative way
 statistics provide researchers with a set of standardized techniques
- they are recognized throughout the scientific community
- each separate researcher is familiar with the used statistical methods
for any analysis
1.2 populations and samples
 research begins with a general question about a specific group of
individuals
 the group of interest is called a population
 population – the set of all individuals of interest in a particular study
 populations are defined by the investigators and their size depends on
what problem the researcher is looking into
 the population does not necessarily consist of people – it could be
animals, inanimate objects, corporations
 populations are typically very large
 the population being studied should always be identified by the
researcher
 researchers usually select a more manageable group from the
population and limit their studies to these selected individuals –
sampling
 sample – a set of individuals selected from a population, usually
intended to represent the population in a research study
- it is better for it to be representative
- a sample should always be identified in terms of the population from
which it was selected
 when a sample has been examined, the goal is to generalize the results
back to the entire population in order to answer the general question
about the population
1.3 variables and data

, researchers are usually interested in specific characteristics of the
individuals in the population/sample or they are interested in outside
factors that may influence the individuals
 variable – a characteristic/ condition that changes or has different
values for different individuals
ex. height, weight, gender, personality, environmental conditions
(temperature, time of the day)
 in order to demonstrate changes in the variables, it is necessary to
make measurements of the variables being examined
 datum/ score/ raw score – the obtained single measurement/
observation for each individual
 data set/ data – the complete set of scores
- data – measurements or observations
- data set – a collection of measurements/observations
 population/samples can refer to both individuals and scores
- research involves measuring each individual to obtain a score,
therefore every population/ sample of individuals produces a
corresponding population/sample of scores
1.4 parameters and statistics
 it is necessary to distinguish whether the data came from a population
or from a sample
 parameter – a value (usually numerical)/ characteristic, that describes
a population
- usually derived from measurements of the individuals in the
population
ex. the average score for a population
 statistic – a value (usually numerical)/ characteristic, that describes a
sample
- usually derived from measurements of the individuals in the sample
ex. the average score for a sample
 research begins with a question about a population parameter
 actual data come from a sample and are used to compute sample
statistics
 every population parameter has a corresponding sample statistic
 statistics from samples are the basis for answering questions about
population parameters
1.5 descriptive and inferential statistical methods
 descriptive statistics – statistical procedures used to summarize,
organize and simplify data
- take raw scores and organize/summarize them in a more manageable
form
- the scores are organized in a table/ graph which makes it possible to
see the entire set of scores
- a common technique is to summarize a set of scores by computing an
average
! the average provides a single descriptive value for the entire set
(even if the data set has hundreds of scores)
 inferential statistics – consist of techniques that allow us to study
samples and then make generalizations about the populations from
which they were selected

, - use sample data to make general statements about a population
 sample statistics are used as the basis for drawing conclusions about
population parameters
 samples are selected to be representative
 samples provide only limited information about the population
- a sample is not expected to give a perfectly accurate picture of the
whole population
 sampling error – the naturally occurring discrepancy/ error (by
chance), that exists between a sample statistic and the corresponding
population parameter
- creates the fundamental problem inferential statistics must always
address
 statistics vary from one sample to another because of the specific
people’s characteristics in each sample
 it is unlikely that the statistics obtained for a sample will be identical to
the parameters for the entire population
 the basic concept of sampling error: sample statistics vary from
one sample to another and typically are different from the
corresponding population parameters
 example of sampling error is the error associated with a sample
proportion
ex. a political poll’s results with a +/- 4% (plus-or-minus 4 percentage
points) margin of error
- the margin of error is the sampling error
- the percentages that are reported have been obtained from a sample
and are being generalized to the whole population
- there will always be some margin of error when sample statistics are
used to represent population parameters
 differences are not always systematic – they might be the result of
random factors such as chance
- unsystematic differences that exist from one sample to another are
an example of sampling error
1.6 statistics in the context of research
 descriptive and inferential statistics are used to organize and interpret
data
 sampling error can affect the interpretation of experimental results
- inferential statistical methods are needed to deal with this problem
 general stages of a research study:
1) experiment (comparison of the groups)
2) data collection
3) descriptive statistics are used to organize and simplify the data
- provide a simplified, organized description of the scores in a graph/
with an average sample score
4) inferential statistics are used to interpret the results/ the outcome
- the goal of inferential statistics is to help researchers decide on what
interpretation fits the data (whether the results are due to chance or
whether they reflect an actual difference)

QUESTION:

, 1. In general, descriptive statistics are used to summarize the data from a
research study while inferential statistics are used to determine what
conclusions are justified by the results.

2. Data structures, research methods, statistics
2.1 individual variables: descriptive research
 some studies describe individual variables as they exist naturally
ex. a college official conducting a survey to describe the eating and
study habits of college students
 non-numerical scores are typically described by computing the
proportion/percentage in each category
ex. a newspaper article which states “34.9% of Americans are obese”
which is roughly 35 pounds over healthy weight
2.2 relationships between variables
 most research aims to examine relationships between variables
 to establish the existence of a relationship, researchers need to make
observations/ measurements of the variables
- the measurements can be classified into two distinct data structures
that also help classify different research methods and different
statistical techniques
 data structures:
1) correlational method – one group with two variables measured for
each individual
- observation of the two variables as they exist naturally in order to
examine the relationship = simple measurement of the two variables
for each individual
- consistent patterns in data provide evidence for a relationship
- consistent patterns in the data are easier to see if the scores are
presented in a graph/ scatterplot

QUESTION:
1. In a correlational study how many variables are measured for each
individual and how many groups of scores are obtained?
ANSWER: 2 variables and 1 group

- in a scatterplot each individual is represented by a point/ dot
2) experimental and non-experimental methods – comparing two
or more groups of scores
- the relationship between variables is examined by using one of the
variables to define the groups (independent = manipulated variable)
and then measuring the second variable to obtain scores for each
group (dependent = measured variable)
- systematic differences between groups provide evidence for an
existing relationship
 correlational method = correlational research strategy – two
different variables are observed to determine whether there is a
relationship between them
2.3 statistics for the correlational method

Voordelen van het kopen van samenvattingen bij Stuvia op een rij:

Verzekerd van kwaliteit door reviews

Verzekerd van kwaliteit door reviews

Stuvia-klanten hebben meer dan 700.000 samenvattingen beoordeeld. Zo weet je zeker dat je de beste documenten koopt!

Snel en makkelijk kopen

Snel en makkelijk kopen

Je betaalt supersnel en eenmalig met iDeal, creditcard of Stuvia-tegoed voor de samenvatting. Zonder lidmaatschap.

Focus op de essentie

Focus op de essentie

Samenvattingen worden geschreven voor en door anderen. Daarom zijn de samenvattingen altijd betrouwbaar en actueel. Zo kom je snel tot de kern!

Veelgestelde vragen

Wat krijg ik als ik dit document koop?

Je krijgt een PDF, die direct beschikbaar is na je aankoop. Het gekochte document is altijd, overal en oneindig toegankelijk via je profiel.

Tevredenheidsgarantie: hoe werkt dat?

Onze tevredenheidsgarantie zorgt ervoor dat je altijd een studiedocument vindt dat goed bij je past. Je vult een formulier in en onze klantenservice regelt de rest.

Van wie koop ik deze samenvatting?

Stuvia is een marktplaats, je koop dit document dus niet van ons, maar van verkoper anniedeshkova. Stuvia faciliteert de betaling aan de verkoper.

Zit ik meteen vast aan een abonnement?

Nee, je koopt alleen deze samenvatting voor €7,49. Je zit daarna nergens aan vast.

Is Stuvia te vertrouwen?

4,6 sterren op Google & Trustpilot (+1000 reviews)

Afgelopen 30 dagen zijn er 52928 samenvattingen verkocht

Opgericht in 2010, al 14 jaar dé plek om samenvattingen te kopen
Start met verkopen
€7,49  1x  verkocht
  • (0)
In winkelwagen
Toegevoegd