100% tevredenheidsgarantie Direct beschikbaar na betaling Zowel online als in PDF Je zit nergens aan vast
logo-home
Strategy Analytics Notes + Book €6,31
In winkelwagen

College aantekeningen

Strategy Analytics Notes + Book

 0 keer verkocht

The document has all my notes from the classes and videos. I integrated all the book parts that were missing from the lectures, but I would recommend reading the chapter the professor requires before class, it makes things easier. The case studies are missing. My final grade for the exam was 8,42, ...

[Meer zien]
Voorbeeld 4 van de 45  pagina's

  • 17 mei 2024
  • 45
  • 2023/2024
  • College aantekeningen
  • Mohammad nasiri
  • Alle colleges
book image

Titel boek:

Auteur(s):

  • Uitgave:
  • ISBN:
  • Druk:
Alles voor dit studieboek (2)
Alle documenten voor dit vak (5)
avatar-seller
vittoriamgmazzoni
Strategy Analytics
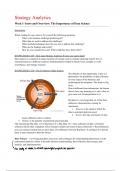
Week 1- Intro and Overview: The Importance of Data Science

Instructions

When reading the case, answer for yourself the following questions:
- What is the business challenge/problem/goal?
- What data are used to address this challenge?
- What methods/techniques does the case use to address this challenge?
- What are the findings and results?
- How do you evaluate this case? What could they have done better?

KNOWLEDGE CLIP - How does Strategy Analytics fit into your career plan?
Data analysis is connected to many elements of strategy such as strategic planning (maybe how to
internationalize to a different country); implementation (related to the previous example as well);
consultancy; and strategy research.

KNOWLEDGE CLIP - The Evolution of Data Science
The ubiquity of data opportunity is due to 2
phenomena: the possibility of data collection
in every aspect of the business; and
technological development. This leads to Big
Data.
Data is different from information, the former
doesn’t have any meaning to it, only when we
give some sort of interpretation to it.

Big data is a very large data set. It has three
distinctive characteristics causing its
importance.
1. Velocity, is the speed at which the
data is generated and processed.
2. Variety, the type, and nature of data
(many different sources of data).
3. Volume, is the quantity of generated and stored data.
The terminology Big Data 1.0 vs Big Data 2.0 vs Big Data 3.0 = Own collection of data vs External
collection (from other companies whose business models are based on data collection) vs Recombination
(you can connect internal data to outer data). The difference between Big Data 1.0 and Big 2.0 is that the
latter is more interactive than the former.

Data Science → involving principles, processes, and techniques for understanding phenomena via the
(automated) analysis of data. It includes business understanding, data collection, data storage, data
analysis, and implementation.

,Data Mining → the extraction of knowledge from data, via technologies that incorporate these principles.
The ultimate goal is to understand data analytics thinking and data analysis. As you do so, you can start to
introduce Data-Driven Decision Making →you base your business decisions rather than just instinct.
The main uses are marketing ( online advertising, cross-selling, customer relationship management),
finance (credit scoring and trading, fraud detection, and workforce management), and retail (marketing
and supply chain management).

What is a relatively new application of data analytics?
- HR, to scan through CVs and applications and select only the appropriate people.
- Maintenance, also in high-tech industries.

KNOWLEDGE CLIP - When (not) to Use Data Analytics
What is Data Analytics?→ the process of examining datasets to conclude the useful information they may
contain. There are different types of data analytics: descriptive analytics (BI), which analyzes what has
happened through simple descriptive statistics, and simple correlation methods, you look at the singular
components; predictive analytics, which focuses on what could happen, and involves regression,
classification, and many other advanced correlation methods, you look at the relation between the
components; prescriptive analytics, focuses on what should we do? It comprehends A-B testing, advanced
econometric techniques, and studies causality, you look at the direction of the relationship between the
components. Data analytic thinking →Carefully applying data analytics to solve data science problems.

Different types of decisions can be made with data analytics.
1. Those that need a discovery. They will have a big impact. An example is Walmart before a big
hurricane in Florida.
2. Repetitive decisions. They have little impact on the bottom line since you do them over and over
again. An example can be preventing customer churn.
One challenge of big data is making sense of the information. In a large data set you will find informative
descriptive information, however, looking too hard at the data will allow you to find something that might
not generalize beyond the data you are looking at. You need to separate the information from the “noise”.

What we are going to do is Knowledge Discovery and Data Mining (KDD), which is a subfield of
machine learning.
Data science wants to predict something, it doesn’t care in general why something is happening, and we
are not interested in the causality. We are not interested in statistics. We are using data science methods
for strategic reasons. Data science (prediction) is neither econometrics (correlation and causality)
nor the field of statistics (interested in whether an observed distribution is likely to
come from a random distribution)

You have to make sure that your organization can use data science. There must be human capital and
incentives for the employees; the right culture which has data science at the core of strategy making; the
right infrastructures, so the data to analyze; and the organization, you want to be better than others, you
want to organize a center of excellence and have local implementation. Therefore, rely heavily on
business understanding; Always separate training, test, and use data; Also, this is why we are not
interested in R2 or P-values (though we will use other tools to evaluate models).

,KNOWLEDGE CLIP - The Data Mining Process
The data mining process is a cross-industry standard process for data mining/analytics. This model helps
to transform business problems into data science problems.

From business problems to data mining problems→ collaboration between business stakeholders and data
scientists. There are steps to this process.
1. Decomposing a business problem into solvable subtasks.
2. Matching the subtasks with known tasks for which methods and data are available or collectible.
3. Solving the remaining non-matched subtasks.
4. Composing the subtasks to solve the overall problem.
5. Re-evaluation continuously. Once you transform the business problem into a data science one and
have seen the results, you will improve the business understanding, and the understanding of the
business problem as well.

There are some questions to answer during the process to go through it. What is the goal of the data
science task? Understand the goal to focus only on what you want to maximize. What is the business
context? This can help with the precious question, the business context helps to understand which is the
best metric. What is the data available or collectible? Evaluate the data and understand their meaning, it is
important to understand what a certain kind of data says in a specific situation. What is the appropriate
method to reach the goals? How can the method be applied to the data?

The data mining process might seem relatively straightforward, but why is it so important to follow this?
It provides a list to check in during the process to see if you are on track. You can switch back and forth
from one step to the other to make changes and build a better model.

KNOWLEDGE CLIP - Typology of Data Science Methods
How to categorize the different data science methods to pick the best one for our analysis.

The main characteristic of the methods is whether they are supervised or not. The key question is “Is there
a specific target variable we are interested in?” if yes, then the method needs to be supervised, if not the
method can be unsupervised.

Unsupervised learning → The training data provides no specific outcomes. The taring data provides
samples. We try to understand what kind of patterns can we see in the data. A machine finds specific
patterns in the data: clustering puts them in different categories based on their similarities; anomaly
detection finds unusual records; association discovery finds rows that are associated with some specific
features. The algorithms it uses are clusters, anomaly detection, and association discovery. You cannot
compare one model to the other model since they have no outcome predecided. Some examples of
questions you might ask are: are these customers similar? (customer demographic data); is this transaction
unusual? (previous transaction characteristics data).

, Supervised Learning → The training data has one particular feature which is the target. The goal is to
build a model to predict the target (the machine learns to predict), based on what happened in the past the
machine learns to predict what will happen in the future. If the target variable is categorical you have a
classification model, if the target variable is numeric you have a regression model. Under additional
assumptions, you might have a causal model. There are different algorithms for this: tree analysis,
(logistic) regression, and advanced econometric and Bayesian techniques.
The models can be evaluated since the data has a known value. You might split the data in taring and test
the set and see which one has more right values.
Some examples of questions you might ask are: how much is this home worth? (previous home price and
characteristics data); will this customer default on a loan? (previous loan default status and
characteristics).

Which methods are supervised and which are not?


Classification - Regression - Causal Modeling → Supervised
Clustering- Profiling - Co-occurrence grouping → Unsupervised
Similarity Matching - Link Prediction - Data Reduction → Can be both. Depending on what we do.

Which of the supervised vs unsupervised methods will be most useful comparatively in need discovery and repetitive
decision problems?
Unsupervised might be better for discovery since it might help to understand the data before you any inferences
about it. Repetitive decisions need to have a target, so supervised methods are the only way to go.

CHAPTER 1 - Introduction: Data Analytic Thinking
Data mining techniques have a wide application in numerous fields. It is used for general customer
relationship management to analyze customer behavior and increase value creation. In finance, it is used
for credit score calculation, fraud detection, etc.

Voordelen van het kopen van samenvattingen bij Stuvia op een rij:

Verzekerd van kwaliteit door reviews

Verzekerd van kwaliteit door reviews

Stuvia-klanten hebben meer dan 700.000 samenvattingen beoordeeld. Zo weet je zeker dat je de beste documenten koopt!

Snel en makkelijk kopen

Snel en makkelijk kopen

Je betaalt supersnel en eenmalig met iDeal, creditcard of Stuvia-tegoed voor de samenvatting. Zonder lidmaatschap.

Focus op de essentie

Focus op de essentie

Samenvattingen worden geschreven voor en door anderen. Daarom zijn de samenvattingen altijd betrouwbaar en actueel. Zo kom je snel tot de kern!

Veelgestelde vragen

Wat krijg ik als ik dit document koop?

Je krijgt een PDF, die direct beschikbaar is na je aankoop. Het gekochte document is altijd, overal en oneindig toegankelijk via je profiel.

Tevredenheidsgarantie: hoe werkt dat?

Onze tevredenheidsgarantie zorgt ervoor dat je altijd een studiedocument vindt dat goed bij je past. Je vult een formulier in en onze klantenservice regelt de rest.

Van wie koop ik deze samenvatting?

Stuvia is een marktplaats, je koop dit document dus niet van ons, maar van verkoper vittoriamgmazzoni. Stuvia faciliteert de betaling aan de verkoper.

Zit ik meteen vast aan een abonnement?

Nee, je koopt alleen deze samenvatting voor €6,31. Je zit daarna nergens aan vast.

Is Stuvia te vertrouwen?

4,6 sterren op Google & Trustpilot (+1000 reviews)

Afgelopen 30 dagen zijn er 64450 samenvattingen verkocht

Opgericht in 2010, al 15 jaar dé plek om samenvattingen te kopen

Start met verkopen
€6,31
  • (0)
In winkelwagen
Toegevoegd