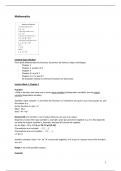
This is an extensive summary of the video lectures of each week (class notes) screens of important example questions discussed during the Q&A, and more examples. Studying this and practicing the old exams will guarantee that you pass the course! Good luck.
Content Exam October:
From book Mathematics for Business Economics by Hamers, Kaper and Kleppe:
- Chapter 1
- Chapter 2, except 2.3.3
- Chapter 3
- Chapter 4.1 and 4.2
- Chapter 5.1, 5.3 and 5.7
- All examples related to minimum function are dismissed.
Lecture Week 1, Chapter 1
Function
= With a function you have one or more input variables (independent variable), and an output
variable (dependent variable).
Example: input variable = x, and then the function is x2 (whatever you put in, you must square it), and
the output is y.
So the function is: y(x) = x2
D(p) = 10-p
z(xy) = √x + xy2
Domain (D) of a function = set of values that you can use as an input.
Depends on what the input variable is, example: price (p) cannot be negative so p ≥ 0. Also depends
on what the output variable is, example: demand (D) cannot be negative.
So, for D(p) = 10-p → 0 ≤ p ≤ 10 OR p∈[0,10]
if boundaries are included: .. ∈[.. , ..]
if boundaries are not included: .. ∈(.. , ..)
x∈(0,∞)
Another example: z(xy) = √x + xy2 → x cannot be negative, as it is put in a square root in the function.
So x ≥ 0.
Range = set of all possible outputs.
Example:
1
,Input: litres of petrol sold (q)
Output: revenue (R)
Function: R(q) = 1.65q
Domain: 0 ≤ q ≤ 5000
Range: 0 – 8250
Graph:
A zero of a function
= solution of the equation
y(x) = 0
y is in this case 0, and the points that come out are all the points of the graph crossing the x-as.
In this case, only mention the outcomes of x! so x = …
Thus, y is always zero so no need to write it down.
Intersection point = the points where two graphs intersect
Elementary functions
1. Constant function: y(x) = c
- Always same answer
- Example: y(x) = 3 or y(x) = 5 1/3
- Graph: horizontal line crossing the y-as at one point
2. Linear function: y(x) = ax + b
- a≠0
- a = slope
- b crosses the y-as.
- Graph:
- Zero of a linear function:
solve y(x) = 0
-
- a = y 2 – y 1 / x 2 – x1
2
,- Example linear functions: y(x) = 5x + 3 and z(x) = -4x
a. Determine the zeros of y(x) and z(x).
So: y(x) = 0
5x + 3 = 0
5x = -3
x = -3/5
z(x) = 0
-4x = 0
x=0
b. Draw the graphs of y(x) and z(x).
Find two points and connect them.
c. Determine the intersection point of the graphs of y(x) and z(x).
y(x) = z(x)
5x + 3 = -4x
5x + 4x = -3
9x = -3
x = -3/9 = -1/3
y(-1/3) = 5 * -1/3 + 3 = 4/3
3. Quadratic functions: y(x) = ax2 + bx + c
- a≠0
- Graph:
a > 0, ∪
a < 0, ∩
- Example: y(x) = x2 – 5x + 2
a. Zeros of a quadratic function:
→ IMPORTANT!!!
x = 5 + √ or x = 5 - √
b. Graph:
a = 1, so ∪.
Already have the points on x-as, now find the point where x=0, so the y-as. This is c.
- Discriminant (D): b2 – 4ac
D > 0: 2 zeros → 2 points on x-as
D = 0: 1 zero → 1 point on the x-as
D < 0: no zero → no point on x-as
3
, - Example: y(x) = 2x2 + px + 4 ½. Determine the values of p such that:
a. y(x) has no zeros:
First: solve D = 0
D = b2 – 4ac
D = p2 – 4 * 2 * 4 ½
D = p2 – 36 = 0
p2 = 36
p = √36 = 6 or -6
So:
It must be: -6 < p < 6
b. y(x) has one zero:
D = p2 – 36
So p2 must be 36, so p = √36 = 6 or -6.
c. y(x) has two zeros:
D = p2 – 36
p = √36 = 6 or -6.
to get 2 zeros: p < -6 or p > 6
Solving inequalities
1. Set the inequality to zero. (Example: h(x) ≥ 0, h(x) > 0, h(x) ≤ 0, h(x) < 0).
2. Determine the zeros of h.
- Solve h(x) = 0
3. Determine the sign chart of h.
4. Find the solution set from the sign chart.
Example: Find all x such that 2x2 + 3x + 2 ≤ 4x + 3.
So:
1.
2x2 + 3x – 4x + 2 – 3 ≤ 0
h(x) = 2x2 – x – 1 ≤ 0
2.
h(x) = 0
4
Voordelen van het kopen van samenvattingen bij Stuvia op een rij:
Verzekerd van kwaliteit door reviews
Stuvia-klanten hebben meer dan 700.000 samenvattingen beoordeeld. Zo weet je zeker dat je de beste documenten koopt!
Snel en makkelijk kopen
Je betaalt supersnel en eenmalig met iDeal, creditcard of Stuvia-tegoed voor de samenvatting. Zonder lidmaatschap.
Focus op de essentie
Samenvattingen worden geschreven voor en door anderen. Daarom zijn de samenvattingen altijd betrouwbaar en actueel. Zo kom je snel tot de kern!
Veelgestelde vragen
Wat krijg ik als ik dit document koop?
Je krijgt een PDF, die direct beschikbaar is na je aankoop. Het gekochte document is altijd, overal en oneindig toegankelijk via je profiel.
Tevredenheidsgarantie: hoe werkt dat?
Onze tevredenheidsgarantie zorgt ervoor dat je altijd een studiedocument vindt dat goed bij je past. Je vult een formulier in en onze klantenservice regelt de rest.
Van wie koop ik deze samenvatting?
Stuvia is een marktplaats, je koop dit document dus niet van ons, maar van verkoper kellymonka. Stuvia faciliteert de betaling aan de verkoper.
Zit ik meteen vast aan een abonnement?
Nee, je koopt alleen deze samenvatting voor €7,36. Je zit daarna nergens aan vast.