100% tevredenheidsgarantie Direct beschikbaar na betaling Zowel online als in PDF Je zit nergens aan vast
logo-home
Summary MVDA SPSS Exam Guide €6,98   In winkelwagen

Samenvatting

Summary MVDA SPSS Exam Guide

 7 keer bekeken  0 keer verkocht

Dit document bevat de meeste (bijna alle) belangrijke opdrachten van de werkgroepen verwerkt in een exam guide. De soort vraag staat dik gedrukt, met daaronder de stappen hoe je het in SPSS moet verwerken (om evt mee naar je tentamen te nemen maar als je de vraagstelling niet meer snap/niet meer we...

[Meer zien]
Voorbeeld 3 van de 25  pagina's

  • 24 oktober 2024
  • 25
  • 2023/2024
  • Samenvatting
Alle documenten voor dit vak (43)
avatar-seller
larathape
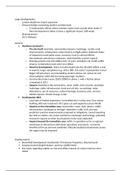
Week 1 | Multiple Regression Analysis (MRA)
When? Independent X1, X2 (INT) + Dependent Y (INT)
Y is always regressed on X
Q: Calculate the Pearson correlations between the five variables.
Analyze > Correlate > Bivariate > insert variables >


Q: What is the sample size N?
Under ‘N’


Q: Does it make sense to perform a linear regression of GPA on IQ, age, gender and/or
self-concept?
Check ‘Correlations’ table and check for each variable the correlation and the significance, if it’s
significant we can say it makes sense or think theoretically


Q: Which variable is likely to be a good predictor of GPA?
Check ‘Correlations’ table and check for each variable the correlation and the significance, if it’s
significant it is likely to be a good predictor


Next, perform a linear regression of GPA on IQ, age, gender and self-concept. In Statistics, ask for
part and partial correlations, and collinearity diagnostics. In Save ask for Cook’s distances and
Leverage values.


Q: Can the null hypothesis of no relationship between GPA and IQ, age, gender and/or
self-concept be rejected?
< Analyze > Regression > Linear > in ‘Statistics’ check ‘part and partial correlations’ and ‘collinearity
diagnostics’ > in ‘Save’ ask for ‘Cook’s distances’ and ‘Leverage values’
H0: none of the predictors are good predictors
Ha: at least some of the predictors are good predictors
• Check ANOVA table > report the F value → e.g. F(dfregression, dfresidual) = value → F(4,73) =
23.117, p<0.001
• If F value is significant, we can reject H0, at least some of the predictors are good predictors


Q: How much variance of GPA is explained by IQ, age, gender and SC together?
• Look at ‘Model Summary’ table > look at R squared > report the value


Q: What predictor explains the most unique variance?
• Look at ‘Coefficients’ table > under ‘correlations’ look at the ‘part’ column > the biggest number
should be squared, that variable explains the most unique variance


Q: Is there evidence of multicollinearity in the predictors?
Test whether we have too much of a dependence between our predictors
• Look at ‘Coefficients’ table and under VIF column > VIF should be below 10 > Tolerance needs to
be bigger than 0.1

,Q: Do Cook’s distances and Leverage values suggest the presence of outliers?
• Formula center leverage value: 3(p+1)/N where p = number of predictors > the value calculated is
the largest value we can have in the centered leverage values > look at ‘Residuals Statistics’ under
‘maximum’ column at ‘centered leverage value’ > determine whether the calculate value is higher
than the maximum value in the table > if value calculated is bigger than given value, it suggests
outliers
• Cook’s distance tells us whether an outlier is influential > look at ‘Residuals Statistics’ > check
Cook’s distance value under ‘minimum’ and ‘maximum’ > should not be higher than 1


Q: If one or more outliers are detected, all previous steps are repeated with exclusion of the
outlier(s). Use Selection to get rid of the outlier(s).
• Look at Data View tab > go to new Cook’s Distance variable > select with right mouse and click
‘sort descending’ > look at which participants have a distance above 1 > don’t delete the participant
> go to ‘Data’ and ‘Select cases’ > click ‘if conditions is satisfied’ and insert criteria of the study (e.g.
participants should be below the age of 14)


Q: Finally, remove the non-significant predictors from the model
• Run the analysis of LRA again > remove Cook’s Distance and Leverage under ‘Save’ > Look at
‘Coefficients’ table and look at whether the variables are significant (<0.05) and determine the ones
that are not significant


Q: Perform a linear regression of GPA on the remaining predictors. In Plots, make a scatter plot
of the standardized predicted values versus the standardized residuals, and ask for the normal
probability plot.
• Run LRA again > remove non-significant predictors > in ‘Plots’ add ZPred to X and ZResid to Y and
check normality probability plot


Q: Is there evidence of non-linearity, heteroscedasticity or non-normality of the residuals?
• Look at ‘Scatterplot’
• Linearity = if one creases the other increases, if one decreases the other one decreases > the plot
should look like there is no relationship (look a bunch of random spots) and if the best description is
a horizontal line there is evidence of non-linearity
• Heteroscedasticity → we want homoscedasticity > so we don’t want differences > check from
value 0 on the Y-axis, if there is approx the same amount of dots on both sides, we don’t violate the
assumption of heteroscedasticity
• Normality → look at ‘Normal P-P Plot of Regression’ > the more the dots are on the line the better
the normality → ??????


Q: What is the estimated regression equation? Interpret the regression coefficients.
• Look at ‘Coefficients’ table > constant = intercept (b0) > b1 = variables > add constant and all
variables in the equation
• ŷ = b0 + b1(var) → use unstandardized


Q: How much variance of GPA is explained by the predictors?

, • Look at ‘Model Summary’ and R squared


Q: What predictor explains the most unique variance?
• Look at ‘Coefficients’ table > look under ‘correlations’ and ‘part’ > report the biggest number and
square it


Hierarchical Regression Analysis
Q: How much variance of VarX is explained by VarY?
• Check ‘Model Summary’ table > check R squared


Q: add VarZ as a predictor in a second block to the linear model. In Statistics, ask for R squared
change
Analyze > Regression > Linear > add predictor to Independent in Next’ Block > in ‘Statistics’ ask for
‘R squared change’ > check the same options under ‘Statistics’


Q: Does adding VarZ significantly improve the linear model?
• Look at the ‘Model Summary’ table > look at R squared change > if the model contributed, the
value under model 2 should be positive (and thus the R square has become higher with model 2 >
report the significaince with F and df


Q: Is there evidence of non-linearity, heteroscedasticity or non-normality of the residuals?


In this example we don’t violate the assumption of linearity, heteroscedasticity, or normality


Q: What is the estimated regression equation? Interpret the regression coefficients.
• Do the same as a normal regression equation, except we now look at the values for model 2
• If everything else remains the same, improving 1 point of the score of VarY (independent), would
make the predicted score of VarX (dependent) … (value of VarY B unstandardized) higher
• If we hold everything else the same, if a participant scores one point higher on VarZ, the predicted
value of VarX (dependent) would become (value of VarZ B unstandardized) higher


Q: How much variance of VarX is explained by VarY and VarZ together?
• Look at ‘Model Summary’ > look at R square model 2 > that would explain the variance


Q: How much variance is uniquely explained by neuroticism?

Voordelen van het kopen van samenvattingen bij Stuvia op een rij:

Verzekerd van kwaliteit door reviews

Verzekerd van kwaliteit door reviews

Stuvia-klanten hebben meer dan 700.000 samenvattingen beoordeeld. Zo weet je zeker dat je de beste documenten koopt!

Snel en makkelijk kopen

Snel en makkelijk kopen

Je betaalt supersnel en eenmalig met iDeal, creditcard of Stuvia-tegoed voor de samenvatting. Zonder lidmaatschap.

Focus op de essentie

Focus op de essentie

Samenvattingen worden geschreven voor en door anderen. Daarom zijn de samenvattingen altijd betrouwbaar en actueel. Zo kom je snel tot de kern!

Veelgestelde vragen

Wat krijg ik als ik dit document koop?

Je krijgt een PDF, die direct beschikbaar is na je aankoop. Het gekochte document is altijd, overal en oneindig toegankelijk via je profiel.

Tevredenheidsgarantie: hoe werkt dat?

Onze tevredenheidsgarantie zorgt ervoor dat je altijd een studiedocument vindt dat goed bij je past. Je vult een formulier in en onze klantenservice regelt de rest.

Van wie koop ik deze samenvatting?

Stuvia is een marktplaats, je koop dit document dus niet van ons, maar van verkoper larathape. Stuvia faciliteert de betaling aan de verkoper.

Zit ik meteen vast aan een abonnement?

Nee, je koopt alleen deze samenvatting voor €6,98. Je zit daarna nergens aan vast.

Is Stuvia te vertrouwen?

4,6 sterren op Google & Trustpilot (+1000 reviews)

Afgelopen 30 dagen zijn er 84669 samenvattingen verkocht

Opgericht in 2010, al 14 jaar dé plek om samenvattingen te kopen

Start met verkopen
€6,98
  • (0)
  Kopen