100% tevredenheidsgarantie Direct beschikbaar na betaling Zowel online als in PDF Je zit nergens aan vast
logo-home
Voortgezette Statistiek en 'R' - hoorcollege - t/m week 1 €7,16   In winkelwagen

College aantekeningen

Voortgezette Statistiek en 'R' - hoorcollege - t/m week 1

 1 keer bekeken  0 keer verkocht

Dit zijn de aantekeningen gemaakt tijdens de hoorcolleges van Voortgezette Statistiek en 'R'. Het vak wordt gegeven aan de Universiteit Utrecht.

Voorbeeld 2 van de 10  pagina's

  • 16 november 2024
  • 10
  • 2024/2025
  • College aantekeningen
  • Erika tsingosi & yann hautier
  • Alle colleges
book image

Titel boek:

Auteur(s):

  • Uitgave:
  • ISBN:
  • Druk:
Alle documenten voor dit vak (21)
avatar-seller
Ribizlik
LECTURE 1: about this course + R and RStudio + fundamentals of statistics VSR

SEMESTER 1 | ERIKA TSINGOSI + YANN HAUTIER


ABOUT THIS COURSE


● learning goals
○ expand statistics toolbox
○ reason about appropriate experimental approaches
and statistical tools
○ critically evaluate analyses and outputs
○ learn the basics of data science
○ master the tools for creating a reproducible analysis
in R
● final grade must be ≥ 5.5
○ attend all computer sessions
○ complete weekly quizzes
○ complete all 4 hand-in assignments (30%) ● ?lm or help(lm) gives you help on lm function
○ pass the exam with a grade ≥ 5.5 (70%) ● helpful sources
○ http://tryr.codeschool.com/
○ http://www.cookbook-r.com/
R AND RSTUDIO ○ https://thecrashcourse.com/courses/what-is%20stat
istics-crash-course-statistics-1/
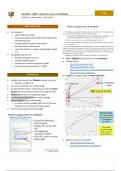
● statistics are done in R not RStudio; Rstudio is the tool ● outlier has a huge impact on the linear regression
○ RStudio is a IDE for R
● you have to annotate your script using #
● R automatically creates a code when you click on Import
Dataset which you need to paste in the script and save
● library() #get a list of all installed packages
● install.packages("ggplot2") #to install a package
● library(‘’ggplot2’’) #to load a package
○ no need to install a package again after it has been
installed, but it’s important to load it again
● hand in assignments need to be in pdf


● ggplot2 = grammar of graphics
○ https://ggplot2.tidyverse.org/
○ http://www.cookbook-r.com/Graphs/


1

, LECTURE 1: about this course + R and RStudio + fundamentals of statistics VSR

SEMESTER 1 | ERIKA TSINGOSI + YANN HAUTIER


○ n – 1 is used because you might get outliers by change
FUNDAMENTALS OF STATISTICS when you take a sample
⎯ sample measurements are on average closer to their
own mean than to the true mean of the population;
SAMPLING
subtracting 1 can correct for that bias when the
sample size is small
● flowchart of a study ○ Ȳ is a random variable
○ execution; while you're collecting data, you should already
make plots to see if the data makes sense


● to find the distribution of Ȳ we sample multiple times
○ when you add the different samples, you get the sampling
distribution of the sample mean Ȳ
○ sampling distribution of Ȳ is a t-distribution
⎯ t-distribution has a lower peak and fatter tails than the
normal distribution
● statistics quantifies uncertainty; statistics is about making sense
of the variation
○ descriptive statistics quantify
⎯ location or central tendency of the data; e.g. mean,
median
⎯ spread of the data; e.g. range, standard deviation
○ comparative statistics
⎯ compare different groups
⎯ based on location and spread
⎯ How likely is the sample compatible with our
expectation?
● population distribution; ideal value we would know if we’d
have perfect knowledge of measured individuals (almost always
impossible to measure)
○ most common measures for location and spread for a
population distribution are mean (μ) and standard
deviation (σ) ○ mu hat: mean of the sampling distribution of Ȳ
⎯ μ: sum of each individual measurement divided by the which is an estimate for the population mean (μ)
total number of measurements ⎯ you sum the sample means and divide it by the
⎯ σ: you square each measurement subtracted from the
number of samples
mean → sum the squares → divide it by the total
○ σȲ = standard deviation of the population / square
number of measurements → take square root;
standard deviation is the square root of the variance root of the sample size
⎯ population μ and σ are constant (they are not random ○ we usually don’t have the population standard
and don’t change, because the population is always deviation σ → that's why we estimate the spread of
the same) Ȳ with the sample standard deviation s
⎯ the estimate is the standard error of the mean =
sample standard deviation / square root of the
sample size


● sample distribution; random subset of the population
○ sample mean (Ȳ) and sample standard deviation (s)

2

Voordelen van het kopen van samenvattingen bij Stuvia op een rij:

Verzekerd van kwaliteit door reviews

Verzekerd van kwaliteit door reviews

Stuvia-klanten hebben meer dan 700.000 samenvattingen beoordeeld. Zo weet je zeker dat je de beste documenten koopt!

Snel en makkelijk kopen

Snel en makkelijk kopen

Je betaalt supersnel en eenmalig met iDeal, creditcard of Stuvia-tegoed voor de samenvatting. Zonder lidmaatschap.

Focus op de essentie

Focus op de essentie

Samenvattingen worden geschreven voor en door anderen. Daarom zijn de samenvattingen altijd betrouwbaar en actueel. Zo kom je snel tot de kern!

Veelgestelde vragen

Wat krijg ik als ik dit document koop?

Je krijgt een PDF, die direct beschikbaar is na je aankoop. Het gekochte document is altijd, overal en oneindig toegankelijk via je profiel.

Tevredenheidsgarantie: hoe werkt dat?

Onze tevredenheidsgarantie zorgt ervoor dat je altijd een studiedocument vindt dat goed bij je past. Je vult een formulier in en onze klantenservice regelt de rest.

Van wie koop ik deze samenvatting?

Stuvia is een marktplaats, je koop dit document dus niet van ons, maar van verkoper Ribizlik. Stuvia faciliteert de betaling aan de verkoper.

Zit ik meteen vast aan een abonnement?

Nee, je koopt alleen deze samenvatting voor €7,16. Je zit daarna nergens aan vast.

Is Stuvia te vertrouwen?

4,6 sterren op Google & Trustpilot (+1000 reviews)

Afgelopen 30 dagen zijn er 77254 samenvattingen verkocht

Opgericht in 2010, al 14 jaar dé plek om samenvattingen te kopen

Start met verkopen
€7,16
  • (0)
  Kopen