Tentamen (uitwerkingen)
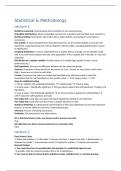
Statistics & Methodology Last-Minute Study Guide + Exam questions
- Instelling
- Tilburg University (UVT)
Quick revision notes for last-minute study, which include 2-3 key questions for each lecture and 20 questions that were asked in the exam. Answers are included.
[Meer zien]