100% tevredenheidsgarantie Direct beschikbaar na betaling Zowel online als in PDF Je zit nergens aan vast
logo-home
Advanced Statistics - Lecture Notes €2,99   In winkelwagen

College aantekeningen

Advanced Statistics - Lecture Notes

 203 keer bekeken  5 keer verkocht

‘Advanced Statistics' is the sequel to 'Introduction Statistics' taught in the first year of the Sociology Bachelor at the University of Amsterdam. The course was taught by Chip Huisman in the academic year . Advanced Statistics focuses on multiple regression techniques, building on previous intr...

[Meer zien]
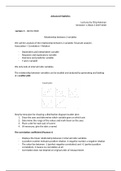
Voorbeeld 4 van de 32  pagina's

  • 28 augustus 2020
  • 32
  • 2019/2020
  • College aantekeningen
  • Onbekend
  • Alle colleges
Alle documenten voor dit vak (7)
avatar-seller
ilariamonese
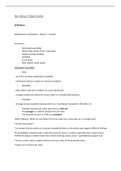
Advanced Statistics

Lectures by Chip Huisman
Semester 1, Block 3 2019-2020

Lecture 1 – 06/01/2020

Relationship between 2 variables

We call the analysis of the relationship between 2 variables ‘bivariate analysis’.
Association = Correlation = Relation

- Dependent and independent variable
- Response and explanatory variable
- Outcome and predictor variable
- Y and x variable

We only look at interval/ratio variables.

The relationship between variables can be studied and analyzed by generating and looking
at a scatter plot.


Step-by-step plan for drawing a distribution diagram/scatter plot:
1. Draw the axes and determine which variable goes on which axis
2. Determine the range of the values and mark them on the axes
3. Place a dot for each pair of scores
4. (If necessary, give the dots a name)

The correlation coefficient (Pearson r)

- Displays the linear relationship between 2 interval/ratio variables
- A positive number indicates positive relation. A negative number a negative relation
- The value lies between -1 (perfect negative correlation) and +1 (perfect positive
correlation). 0 means no correlation at all
- Correlation does not depend on original units of measurement

,Linear relationships
Linear function: y=α + βxx
This formula expresses the values on the y-axis as a linear function of the values on the x-
axis. The formula has a straight line with a slope βx (beta) and y-intercept α.
The slope βx (beta) = a number that indicates how much the value of y increases or
decreases with an increase of one x.
The y-intercept α = a number that indicates where the line crosses the y-axis. This is also
called the constant.
Linear means rectilinear/straight.

Intermezzo
Nominal + order = ordinal
Ordinal + differences equally large = interval
Interval + zero point = ratio

What is a MODEL?
A model is an approximation to reality.
A statistical model is an approximation of a characteristic of individuals within a population.
Everyone within a population has an age. But for a very large population this is very
inconvenient to display. So you give an approximation by calculating the average/mean age.
Ergo, the average/mean is a statistical model.
Similarly, a relationship between two variables within a population can be expressed with a
model.
This relationship between two variables can be represented by a linear function.
Taken together, this is called a linear model.

Least squares prediction equation
Prediction refers to the formal/mathematical aspect of a model. You put data in your model
and your model predicts an outcome.
Estimation refers to the statistical application of a model. You apply a model to sample data
in order to say something about a population. Based on sample data you can estimate a
linear model.
What we try to estimate is the line (a linear model) that best fits the data. The least squares
method (OLS = Ordinary Least Squares) appears to be the most suitable for this.
Prediction and estimation are used interchangeably by many people but there is a
difference.

,Estimating a line based on a cloud of observed data points
We want to find the line that best summarizes data in a line (linear model).
How do we do that?
We need a prediction equation: ^y =a+bx

^y (y-hat) is the predicted value of y given the value of x.

Where we have to calculate the a and the b with:
s ∑ ( x i− x́ )( y i− ý )
b= xy2 =
sx ∑ ( xi −x́)2
a= ý−b x́

Intermezzo
Lower case Greek letters are used for populations parameters.
Roman letters are used for sampling statistics.
The μ (Greek mu) and σ (Greek small sigma) indicate the mean and the standard deviation
of a population (these are often unknown).
ý and s indicate the mean and standard deviation of a sample. These are therefore variables
whose value depends on the sampling.
μ and σ are constants because they are related to observations of the entire population.

ý and s are often used to estimate the often unknown μ and σ .
^y (y-hat) is the predicted value of y given the value of x within a predicted equation.

Formula for the b-coefficient or slope

s xy ∑ ( x i− x́ )( y i− ý )
b= 2
=
s x ∑ ( xi −x́)2
If we divide the covariance by the variance we get the b-coefficient or slope.

Deviation score x = ( x i−x́ )
Deviation score y = ( y i− ý )
Σ (Greek capital sigma) means that you have to add things up.

Step-by-step plan for calculating the b-coefficient:
1. Calculate the means for x and y
2. Calculate all the individual deviations (deviation scores) for x and y
3. Calculate all the individual squared deviations for x
4. Calculate all the deviation scores of x squared
5. Calculate the sum of the deviation scores of x squared
6. Calculate the sum of the deviation scores of x times the deviation scores of y
7. Divide the sum of the deviation scores of x times the deviation scores of y by the sum
of the deviation scores of x squared

, Beware of outliers
An outlier is an extreme value which can have a strong influence on the slope of the
regression line.

The prediction equation has the least squares property

Why is that useful/relevant?
You want the line that gives ^y =a+bx the best fit for our observed cloud of data points.
Therefore you want the smallest Sum of squared errors = SSE.
The SSE is a measure of the discrepancy between the line ^y =a+bx and the cloud of
observed values points.
Properties:
- The sum of the residues is zero
And the line always goes through the center of the data. The point (x́, y´ ¿ ¿

What does the least squares mean and what does the sum of the least squares, or the sum
of squared errors mean?
The line through a point cloud is a model for that point cloud. And you want that model to
represent that point cloud as good as possible.
Real Titanic / Model of Titanic

So, you go look for the best matching/fitting line to the point cloud.
But which line is that? It is the line where the distances between the predicted values for y
and the observed value for y is the smallest. That difference is called the predictor error
(residual).

Point cloud with regression line and residuals -> the most appropriate line is the line where
the sum of the squared residuals is the smallest.


Forecast comparison has the least squares characteristic

- The prediction errors are called residuals:

Voordelen van het kopen van samenvattingen bij Stuvia op een rij:

Verzekerd van kwaliteit door reviews

Verzekerd van kwaliteit door reviews

Stuvia-klanten hebben meer dan 700.000 samenvattingen beoordeeld. Zo weet je zeker dat je de beste documenten koopt!

Snel en makkelijk kopen

Snel en makkelijk kopen

Je betaalt supersnel en eenmalig met iDeal, creditcard of Stuvia-tegoed voor de samenvatting. Zonder lidmaatschap.

Focus op de essentie

Focus op de essentie

Samenvattingen worden geschreven voor en door anderen. Daarom zijn de samenvattingen altijd betrouwbaar en actueel. Zo kom je snel tot de kern!

Veelgestelde vragen

Wat krijg ik als ik dit document koop?

Je krijgt een PDF, die direct beschikbaar is na je aankoop. Het gekochte document is altijd, overal en oneindig toegankelijk via je profiel.

Tevredenheidsgarantie: hoe werkt dat?

Onze tevredenheidsgarantie zorgt ervoor dat je altijd een studiedocument vindt dat goed bij je past. Je vult een formulier in en onze klantenservice regelt de rest.

Van wie koop ik deze samenvatting?

Stuvia is een marktplaats, je koop dit document dus niet van ons, maar van verkoper ilariamonese. Stuvia faciliteert de betaling aan de verkoper.

Zit ik meteen vast aan een abonnement?

Nee, je koopt alleen deze samenvatting voor €2,99. Je zit daarna nergens aan vast.

Is Stuvia te vertrouwen?

4,6 sterren op Google & Trustpilot (+1000 reviews)

Afgelopen 30 dagen zijn er 82871 samenvattingen verkocht

Opgericht in 2010, al 14 jaar dé plek om samenvattingen te kopen

Start met verkopen
€2,99  5x  verkocht
  • (0)
  Kopen