100% tevredenheidsgarantie Direct beschikbaar na betaling Zowel online als in PDF Je zit nergens aan vast
logo-home
Summary Meth. Meas. and Statistics (424023-B-6) (Methods part only) €6,49   In winkelwagen

Samenvatting

Summary Meth. Meas. and Statistics (424023-B-6) (Methods part only)

3 beoordelingen
 134 keer bekeken  1 keer verkocht

All Method lectures given by Guy Moors are included in this summary. The statistics summary is also available on my account. (You can also buy them in a bundle, which is cheaper). If you are looking for an overview of all the slides with additional information told in the lectures, this summary sho...

[Meer zien]
Voorbeeld 3 van de 29  pagina's

  • 9 december 2020
  • 29
  • 2020/2021
  • Samenvatting
Alle documenten voor dit vak (7)

3  beoordelingen

review-writer-avatar

Door: yazidalaouimdaghri1 • 2 jaar geleden

review-writer-avatar

Door: jorritross • 3 jaar geleden

review-writer-avatar

Door: Holycrab • 3 jaar geleden

avatar-seller
maudbressers
Methods summary

Lecture 1
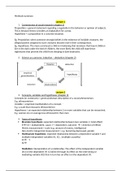
1. Cornerstones of social research (chapter 2)
Proposition = general statement regarding a regularity in the behavior or opinion of subjects.
This is because theory provides an explanation for a prop.
Hypothesis = a proposition in a concrete situation.

Eg. Proposition; when someone strongly beliefs in the existence of invisible creatures, the
alleged powers assigned to such creatures become real in their consequences.
Eg. Hypothesis: The more convinced a child is in believing that monsters that haunt children
live in the dark under the bed of children, the more likely the child will experience
nightmares that prevent the child from sleeping in dark bedrooms.

2. Science as a process: induction – deduction (chapter 2)


Lecture 2
3. Concepts, variables and hypotheses (chapter 3)
Concepts (or constructs) = general/abstract description of a social phenomenon.
E.g. ethnocentrism
Variable = empirical manifestation of a concept. `
E.g. a scale that measures ethnocentrism
Hypotheses = an expected relationship between 2 or more variables that can be researched.
E.g. women are on average less ethnocentric than men

4. Types of hypotheses
 Bivariate hypothesis: expected relationship between two variables (= total effect)
XY (X = Independent, cause. Y = dependent, outcome.  = direction of effect)
Metric measurement = scale (e.g. amount of money, intelligence)
Non-metric/categorical measurement = e.g. becoming depressed, gender
 Multivariate hypothesis: expected relationship between a dependent variable Y and
multiple independent variables X1, X2… (multiple causality)
X1 Y
X2

Mediation: interpretation of a relationship. The effect of the independent variable
(X1) on the dependent (Y) is indirect through its effect on the intervening or
mediating variable (X2) that in turn has an effect on the dependent (Y).

, = indirect effect
X1  X2  Y

Partial mediation: direct + indirect effect
X1  X2  Y
X1  Y

Moderating effect:
Interaction hypothesis. The effect of X1 on Y is conditional on the moderator (X2)
Or
the effect of X1 on Y is different depending on the value of the moderator X2.
= Conditional effect (intensifier (+) or suppressor (-) effect)
X1  Y
X2

Spurious relationship: common cause (antecedent), explanatory hypothesis
(=explanation), an observed relationship between X1 and Y is spurious because they
share a common cause X2.
X2 X1
Y

 The conceptual model: = graphical representation of a set of logically connected
hypotheses = full picture.
 Researching the 3th variable effect: Elaboration (Chapter 15. P. 455-462)
= enhancing or ‘elaborating’ our understanding of a bivariate relationship by
introducing a 3th ‘control’ variable in contingency tables (or cross-tabulations)
= applies to moderation, mediation and spuriousness.
E.g. do religious people eat more fastfood? Dependent = meal preference;
independent = religiosity. Answer= yes they do! Or not…
By adding the variable ‘education’ this relation disappears. Meal preference is
dependent on education.

(Distorter: Simpsons paradox: er is een positieve trend voor elk van twee afzonderlijke
groepen, maar er verschijnt een negatieve trend als de data worden gecombineerd.)

!!!!!

, Lecture 3
5. Causality (chapter 3)
3 necessary conditions to establish causality
a) Association,
b) Direction of the relationship
c) Nonspuriousness (or absence of spuriousness schijncorrelaties) So, not false!

a) Association= statistical relationship between the variables
Need to be a ‘perfect’ relationship. Often ‘week’ relationships observed due to:
- Measurement error (lack of precision)
- Multicausality
b) Direction of the relationship
Independent variable influences dependent variable. Sometimes obvious (characteristics
that are fixed by birth) but not always! E.g. does ethnocentrism influence the contact with
immigrants or does having contact with immigrants influence a person’s level of
ethnocentrism?
c) Nonspuriousness
No extraneous variables or antecedents are allowed to explain the relationship between the
variables interest.
So  that is why taking into account the effect of antecedents is crucial to establish causality
in an empirical situation.
(antecedents are often called control variables. The more control variables in a model the
more likely the relationship is not spurious if still observed when the control variables are
included) So with only 2 variables you are less sure about the relationship than with 4.

6. Unit analysis and nested data (chapter 3)
 Unit of analysis = about whom or what statements are made in the research.
Note: unit of observation may deviate from unit of analysis in a research.
E.g. Unit of analysis = work team (group)
Unit of observation = the direct manager or leader of the work team (who fills in a
questionnaire regarding that work team)

 Nested data = multilevel data
Combining data from different units of observation in which individual cases constitute
elements of larger groups (aggregates)
e.g. European values study = survey research among representative samples across EU
countries.

Information sources at group level:
- National and regional statistics (= in a country-region-individual nested design)
- Data from previous research (matching at the group level) = external aggregation.
- Aggregating individual level data; e.g. % of unemployed with the different regions (=
internal aggregation)

7. Logical fallacies (chapter 3) = denkfout
= drawing conclusions at one level while analyzing findings at another level.

Voordelen van het kopen van samenvattingen bij Stuvia op een rij:

Verzekerd van kwaliteit door reviews

Verzekerd van kwaliteit door reviews

Stuvia-klanten hebben meer dan 700.000 samenvattingen beoordeeld. Zo weet je zeker dat je de beste documenten koopt!

Snel en makkelijk kopen

Snel en makkelijk kopen

Je betaalt supersnel en eenmalig met iDeal, creditcard of Stuvia-tegoed voor de samenvatting. Zonder lidmaatschap.

Focus op de essentie

Focus op de essentie

Samenvattingen worden geschreven voor en door anderen. Daarom zijn de samenvattingen altijd betrouwbaar en actueel. Zo kom je snel tot de kern!

Veelgestelde vragen

Wat krijg ik als ik dit document koop?

Je krijgt een PDF, die direct beschikbaar is na je aankoop. Het gekochte document is altijd, overal en oneindig toegankelijk via je profiel.

Tevredenheidsgarantie: hoe werkt dat?

Onze tevredenheidsgarantie zorgt ervoor dat je altijd een studiedocument vindt dat goed bij je past. Je vult een formulier in en onze klantenservice regelt de rest.

Van wie koop ik deze samenvatting?

Stuvia is een marktplaats, je koop dit document dus niet van ons, maar van verkoper maudbressers. Stuvia faciliteert de betaling aan de verkoper.

Zit ik meteen vast aan een abonnement?

Nee, je koopt alleen deze samenvatting voor €6,49. Je zit daarna nergens aan vast.

Is Stuvia te vertrouwen?

4,6 sterren op Google & Trustpilot (+1000 reviews)

Afgelopen 30 dagen zijn er 67866 samenvattingen verkocht

Opgericht in 2010, al 14 jaar dé plek om samenvattingen te kopen

Start met verkopen
€6,49  1x  verkocht
  • (3)
  Kopen