Stabu Samenvattingen, Aantekeningen en Examens
Op zoek naar een samenvatting over Stabu? Op deze pagina vind je 42 samenvattingen over Stabu.
Pagina 4 van de 42 resultaten
Sorteer op
-
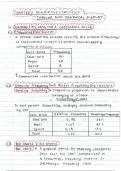
Descriptive Statistics_ Tabular and Graphical Display
- Samenvatting • 6 pagina's • 2023
- €2,64
- + meer info
Statistics - STK110. A set of comprehensive and organized notes that cover all aspects of first year statistics (University). These notes are typically created to aid in the study, understanding, and application of statistical concepts. Fundamental and key points are well-detailed in the form of summaries of Chapter 1-10 of the 'Modern business statistics with microsoft excel' textbook.

-
STATISTICS - TABULAR AND GRAPHICAL PRESENTATIONS
- Tentamen (uitwerkingen) • 23 pagina's • 2023
- €28,10
- + meer info
STATISTICS - TABULAR AND GRAPHICAL PRESENTATIONS
-
Samenvatting Calculeren 1
- Samenvatting • 23 pagina's • 2021
- €5,99
- 8x verkocht
- + meer info
In deze samenvatting zijn alle lessen en PowerPoints van het vak calculeren 1 opgenomen. In deze samenvatting wordt veel behandeld wat goed te gebruiken is om je optimaal voor te bereiden voor het tentamen calculeren 1. Bevalt deze samenvatting? Laat dan een review achter!
-
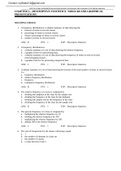
CHAPTER 2—DESCRIPTIVE STATISTICS: TABULAR AND GRAPHICALPRESENTATION
- Tentamen (uitwerkingen) • 23 pagina's • 2022
- €10,59
- + meer info
CHAPTER 2—DESCRIPTIVE STATISTICS: TABULAR AND GRAPHICALPRESENTATIONA frequency distribution is a tabular summary of data showing the a. fraction of items in several classes b. percentage of items in several classes c. relative percentage of items in several classes d. number of items in several classes ANS: D PTS: 1 TOP: Descriptive Statistics 2. A frequency distribution is a. a tabular summary of a set of data showing the relative frequency b. a graphical form of representing data c. a tabula...
-
Prophecy Core Mandatory Part 3 Nursing Solved 2022. Which statement is accurate concerning the portability of advanced healthcare directives Which of the following statements is NOT accurate regarding signs of abuse Hostile work environment sexual harassm
- Tentamen (uitwerkingen) • 95 pagina's • 2023
- €14,74
- + meer info
Prophecy Core Mandatory Part 3 Nursing Solved 2022. Which statement is accurate concerning the portability of advanced healthcare directives Which of the following statements is NOT accurate regarding signs of abuse Hostile work environment sexual harassment involves harassment by Workplace violence is defined as threats, physical assaults, muggings and Which of the following statements is accurate Which of the following statements is accurate concerning restraints When caring for victims of abu...

Wekelijks betaald worden? Kan gewoon!


-
Prophecy Core Mandatory Part 3 Nursing Solved 2022. Which statement is accurate concerning the portability of advanced healthcare directives Which of the following statements is NOT accurate regarding signs of abuse Hostile work environment sexual harassm
- Tentamen (uitwerkingen) • 95 pagina's • 2023
- €12,90
- + meer info
Prophecy Core Mandatory Part 3 Nursing Solved 2022. Which statement is accurate concerning the portability of advanced healthcare directives Which of the following statements is NOT accurate regarding signs of abuse Hostile work environment sexual harassment involves harassment by Workplace violence is defined as threats, physical assaults, muggings and Which of the following statements is accurate Which of the following statements is accurate concerning restraints When caring for victims of abu...
-
STATISTICS - TABULAR AND GRAPHICAL PRESENTATIONS
- Samenvatting • 23 pagina's • 2022
- €16,58
- + meer info
STATISTICS - TABULAR AND GRAPHICAL PRESENTATIONS

-
Test bank statistics for business and economics: Tabular & Graphical Presentations.
- Tentamen (uitwerkingen) • 24 pagina's • 2021
- €14,00
- + meer info
STATISTICS STUDY GUIDE -LATEST 1. A frequency distribution is a tabular summary of data showing the a. fraction of items in several classes b. percentage of items in several classes c. relative percentage of items in several classes d. number of items in several classes 2. A frequency distribution is a. a tabular summary of a set of data showing the relative frequency b. a graphical form of representing data c. a tabular summary of a set of data showing the frequency of items in each of several ...
-
MATH 110 - Introduction to Statistics Math 110 Module 2 EXAM Descriptive Statistics: Tabular, Graphical & Numerical Methods
- Tentamen (uitwerkingen) • 7 pagina's • 2022
- €7,36
- + meer info
Exam Page 1 During an hour at a fast food restaurant, the following types of sandwiches are ordered: Hamburger Cheeseburger Fish Hamburger Turkey Fish Chicken Chicken Fish Turkey Fish Hamburger Fish Cheeseburger Fish Cheeseburger Hamburger Fish Fish Cheeseburger Hamburger Fish Turkey Turkey Chicken Fish Chicken Cheeseburger Fish Turkey Fish Fish Hamburger Fish Fish Turkey Chicken Hamburger Fish Cheeseburger Chicken Chicken Turkey Fish Hamburger Chicken Fish a) Make a frequency distribut...
-
MGMT 123 Business Statistics Tabular and Graphical Presentations QUESTIONS & ANSWERS 100% CORRECT/VERIFIED ANSWERS LATEST UPDATE GRADED A+
- Tentamen (uitwerkingen) • 85 pagina's • 2022
- €16,58
- + meer info
MGMT 123 Business Statistics Tabular and Graphical Presentations QUESTIONS & ANSWERS 100% CORRECT/VERIFIED ANSWERS LATEST UPDATE GRADED A+
