Trendline Samenvattingen, Aantekeningen en Examens
Op zoek naar een samenvatting over Trendline? Op deze pagina vind je 90 samenvattingen over Trendline.
Pagina 4 van de 90 resultaten
Sorteer op

-
Stats 350 - Exam 1. Kansas State University Questions and Answers 2024
- Tentamen (uitwerkingen) • 2 pagina's • 2024
- €13,75
- + meer info
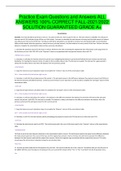
Stats 350 - Exam 1. Kansas State University Questions and Answers 2024 What is Simpson's paradox? A situation in which conclusions reached from combined cross tabulations are reversed when using the uncombined cross tabulations The measure of location which is the most likely to be influenced by extremely large values in the data set is the? Mean What is a Standard Normal Distribution? A normal distribution with the mean of 0 and a standard deviation of 1 What is the Re...

-
WGU C723 - Quantitative Analysis for Businesses Exam Questions with Correct Answers
- Tentamen (uitwerkingen) • 5 pagina's • 2023
- €12,33
- + meer info
Quantitative Analysis Correct Answer Analysis using objective data. Qualitative Analysis Correct Answer Analysis using subjective data. Response Variable Correct Answer Another name for the dependent variable. Explanatory Variable Correct Answer Another name for the independent variable. Negative Correlation Correct Answer Correlation that occurs when one variable increases and the other variable decreases. Positive Correlation Correct Answer Correlation that occurs when one varia...
-
PMAN 639 PROJECT QUALITY MANAGEMENT FINAL EXAM- Spring 2023 Latest Graded A+.
- Tentamen (uitwerkingen) • 14 pagina's • 2023
- €10,43
- + meer info
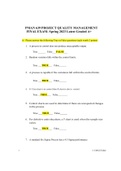
PMAN 639 PROJECT QUALITY MANAGEMENT FINAL EXAM- Spring 2023 Latest Graded A+. A. Please answer the following True or False questions (each worth 2 points) 1. A process in control does not produce unacceptable output. True ______ False___FALSE___ 2. Random variation falls within the control limits. True ___TRUE___ False______ 3. A process is capable if the variations fall within the control limits. True ___TRUE___ False______ 4. If X bar chart is in control then R chart is also in control...
-
CISM 2530 Chapter 3 exam 2023 with 100% correct answers
- Tentamen (uitwerkingen) • 6 pagina's • 2023
- €15,65
- + meer info
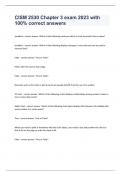
trendline - correct answer -Which of the following could you add to a chart to predict future values? trendline - correct answer -Which of the following displays averages in your data and can be used to forecast data? False - correct answer -True or False? Filters alter the source data range. False - correct answer -True or False? Elements such as the chart or plot area do not usually benefit from the use of an outline. XY chart - correct answer -Which of the following charts d...

-
Excel Exam 62 Questions with Verified Answers,100% CORRECT
- Tentamen (uitwerkingen) • 5 pagina's • 2024
- €10,52
- + meer info
Excel Exam 62 Questions with Verified Answers spreadsheet - CORRECT ANSWER an electronic file that contains a grid of columns and rows containing related data worksheet - CORRECT ANSWER s spreadsheet that contains formulas, functions, values, texts, and visual aids workbook - CORRECT ANSWER a file containing related worksheets input area - CORRECT ANSWER a range of cells containing values for vairables used in formulas output - CORRECT ANSWER a range of cells containing results ba...

Wil jij je uitgaves terugverdienen?


-
Email Marketing Hubspot Academy Course Exam 2024
- Tentamen (uitwerkingen) • 41 pagina's • 2024
- €11,38
- + meer info
So where do email and the inbound methodology intersect? 1. Attract, where you’ll attract strangers and turn them into visitors. This can mean many things for you - using blogging and social media and optimizing your website. These are all mediums for publishing and distributing content that people can choose to consume on their own terms, not channels for forcing people to engage with your message. And as technology continues to evolve and develop, there will be more and more mediums for you...
-
Practice Exam Questions and Answers ALL ANSWERS 100% CORRECT FALL-2021/2022 SOLUTION GUARANTEED GRADE A+
- Tentamen (uitwerkingen) • 11 pagina's • 2021
- €11,38
- 16x verkocht
- + meer info
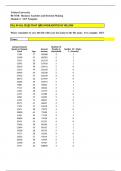
Scenario: You have decided to purchase a new car. You plan to take out a loan to pay for the car. The loan amount is $18,900. You will pay an interest rate of 6.5% and plan to pay off the car in 48 months. You want to calculate the total amount of money and the total amount of interest you will pay over the course of the loan. To help you with these calculations, you decide to construct an amortization table. An amortization table provides details about the payment, interest amount, principal am...

-
Spreadsheets_for_Business_Analytics_Week14_LinearRegression
- Tentamen (uitwerkingen) • 2 pagina's • 2024
- €9,95
- + meer info
Linear Regression Open the attached .csv file. Select Regression from the data analysis tab Weight will be our predictor variable and MPG the response variable. Select your x (predictor) and y (response) ranges accordingly. Check the labels button and and output cell. Observe the ANOVA matrix. The F-statistic will tell you whether your model is better than simply using the mean. You will want the F-statistic to be as high as possible and the significance to be as low as possible. The equati...
-
BUS520: Business Analytics and Decision Making
- Overig • 13 pagina's • 2023
- €6,16
- + meer info
BUS520: Business Analytics and Decision Making QUESTION 3: What does the trendline indicate about the relationship between these two variables? QUESTION 5: Interpret the correlation coefficient QUESTION 7: Add the equation for the best-fit line on the chart. QUESTION 8: Does this equation match the linear regression equation from the Case for this Module? Explain.
-
CMT Level 1 - Sample Questions 2 With Correct Answers
- Tentamen (uitwerkingen) • 42 pagina's • 2023
- €11,85
- + meer info
Cycles are most likely measured a. low to low. b. low to high. c. high to low. d. high to high. - Answer a. (low to low.) Reference: Pring, 2002, Technical Analysis Explained, 4th Edition, Chapter 21, p. 391 Which of the following is the most important aspect of a cycle in studying the relationship between cycles of different lengths? a. Phase b. Period c. Amplitude - Answer a. (Phase) Reference: Kirkpatrick & Dahlquist, 2011, Technical Analysis, 2nd Edition, Chapter 1...
