Econometrics Unit 1 Study Guide || very Flawless.
1. What is a dummy/binary/indicator variable?
2. What are the 2 types of data?
3. What is econometrics?
4. What are the 2 branches of statistics? correct answers 1. Takes values of 0 or 1 to indicate
whether some condition is met
0 = no
1 = yes
2. i. Experimental = researcher manipulates the values to see the effect
--> Hard to run large experiments
ii. Observational = real world observations of how variables relate to each other (most of econ)
3. Econometrics = statistical analysis + economic theory
4. 2 branches:
i. Descriptive stat (sample): presenting characteristics of a sample
ii. Inferential stat (population: guessing properties of the population
1. What is a population?
2. What is a parameter?
3. What is a sample?
4. What is a statistic? correct answers 1. Population = group of interest to researcher
2. Parameter = values from the population
3. Sample = subset of population that is available to researcher (what we look at as representative
of the population)
4. Statistic = values from the sample
1. What are the different organizations of data?
2. What are the common measures of central tendency? What do they express?
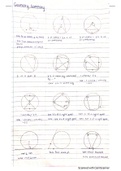
3. i.What is left skew?
ii. What is right skew?
iii. What is symmetric distribution? correct answers 1.
i. Cross Sectional- many observations observed once
ii. Time Series- single observation over time
iii. Panel data- many observations over time
2.
i. Mean, median, and mode = average, middle, most common values
ii. They express a "typical" value
3.
i. Left skew = data skewed AWAY from the left ____/\ (median > mean)
,ii. Right skew = data skewed AWAY from the right /\____ (median < mean)
--> More frequency of people with lower values than higher values!
--> ie- property values, income/wealth, etc. --> more poor people and tiny number of rich people
who accumulated wealth through theft lol
iii. Symmetric distribution = data is symmetric __/\__ (median = mean)
--> Less frequency of people with higher values than higher values!
--> ie- distribution of scores on tests
What is the Rule of 72? How is it calculated?
ie- I save money with interest rate of 6% per year. How many years until it doubles? correct
answers Quick way to calculate length of time to double something (typically money):
*72/interest rate*
ie- I save money with interest rate of 6% per year. How many years until it doubles?
Answer: 72/6 = 12 years to double
What are the 3 types of means within classical mathematics? correct answers i. *Arithmetic
mean* = sum of all observations/# of observations
--> Doesn't always work well
--> ie-to beach = 75 mph (150 mi distance; 2 hours)
-from beach = 25 mph (150 mi distance; 8 hours)
--> Total distance = 300 miles in 8 hours--> 300/8 = *actual average speed is 37.5 mph* --> this
is actually using the harmonic mean!
ii. *Geometric mean* = (product of all observations)^(1/# of observations)
--> For growth rates (R=decimal): [(1+R1)(1+R2)...(1+Rn)]^(1/n)]-1
-->) [$100(1+R1)(1+R2)(1+Rn)] = $100(1+R bar)(1+R bar)
--> Rn = decimal form
--> R bar = average interest rate
--> *1+R bar = Sq. Root N[(1+R1)(1+R2)...(1+Rn)]*
--> N = # of observations
--> ie- I'm saving for college. I put $100 into mutual fund with variable rate fo return. I gain 20%
in year 1; lose 20% in year 2. What is the average rate of return?
--> Year 1 = +20% (100 + (0.2x100) = now have $120 in account)
--> Year 2 = -20% (120 - (0.2x120) = now have $96 in account)
--> [$100(1+0.2)(1-0.2)] = $100(1+rate)(1+rate)--> 0.96 = (!+R bar)^2
iii. *Harmonic mean* = sum of all reciprocals of values/# of observations, take reciprocal of that
--> [(1/X1 + 1/X2 + ...1/Xn)/N]^(-1)
--> N = # observations
--> X = each value within N
--> Not uncommon; used for averaging ratios (ie- fuel efficiency, CPI for inflation, etc.)
,--> ie-to beach = 75 mph (150 mi distance; 2 hours)
-from beach = 25 mph (150 mi distance; 8 hours)
--> Harmonic mean = [(1/75 + 1/25)/2]^(-1) = *37.5 mph*
--> ie- Car A = 20 miles per gallon; Car B = 40 miles per gallon
Average miles/gallon = ?
--> I drive each car for 80 miles--> 160 miles total for 6 gallons total
--> 160 gallons on 6 gallons--> *avg miles/gallon = 26.69 mpg*
OR using harmonic mean:
--> [(1/20 + 1/40)/2]^(-1) = 26.69 mpg!
1. What are the intent of measures of dispersion?
2. What are the most common measures of this? correct answers 1. These statistics describe
whether values = clustered together or spread out
2. Most common measures =
i. *Standard deviation(population)/variance(sample)*:
--> Variance(u) = [(x1-mean)^2+(x2-mean)^2+(xn-mean)^2]/(N-1)
--> SD(S or Sx) = sq. rt[variance]
Advantages:
i. Includes Chebyshev's inequality = within k SDs of mean, always have at least (1-1/(k^2)) of
the sample within k SDs of mean (k being # SDs away from)
--> Within 2 SDs of mean, always have at least (1-1/(2^2)) = *3/4* of sample to be within those
2 standard deviations. that's literally it
"At least this much falls within..."
ii. Empirical rule (2/3-95-99.9 rule) =
--> Within 1 SD = approx. 2/3% falls in; 1/6 on each tail do NOT fall into the 1 SD
--> Within 2 SDs = approx. 95% falls in; 2.5% on each tail do NOT fall into the 2 SDs
--> Within 3 SDs = approx. 99.9% technically falls in; 0.15% on each end do NOT fall into 3
SDs
"Approximately how much falls within..."
iii. Standardizing values = measuring how many standard deviations you are from the mean (z
score!)
--> z = (x-mean)/standard deviation = standardized the values!
--> ie = 95th percentile = 95% fall below this score; you're in top 5%
ii. *Range*:
--> Advantages: easy to use/understand
--> Disadvantages: dependent on sample size (larger sample = larger range); determined by
unusual values (the outliers); not very useful statistically
, iii. *Interquartile range (difference between 75th + 25th percentiles of distribution)*:
--> Advantages: unaffected by sample size; determined by most common path of the population
--> Disadvantages: less convenient/easy; not very useful statistically
1) What is a logarithm?
Solve the following:
i. log3^81
ii. log2^8
iii. log2^1.41
iv. log2^0.25
2) What are the properties of the logarithm?
3) What are the applications of logarithms? correct answers 1) In theory: how many times do you
multiply x by itself to get n?
logx^k = n --> x^n = k
i.- log3^81 = 4 --> 3^4 = 81
ii.- log2^8 = 3 --> 2^3 = 8
iii.- log2^1.41 = 1/2
iv. - log2^0.25 = -2
2) Same base properties (common base = e = ~2.718 = natural logarithm = ln(x)):
i. Logb(x*y) = log(x) + log(y)
ii. Logb(x^a) = a*log(x)
iii. Logb(x/y) = log(x)-log(y)
3) Applications:
i. Find % difference:
ie- 2 values of x--> x1, x2
% difference between those values =~ ln(x2)-ln(x1)
--> x1 = 95
--> x2 = 105
% difference can also be found via...
-Midpoint method = (change in x)/(1/2(x1+x2)) = 10% change
-Elasticity (% change in Q)/(% change in P) = [(new Q-old Q)/old Q]*[old P/(new P-old P)]
ii. Approximating delta:
ln(1+delta) = ~= delta (if delta is close to 0; typically within 0.2 of 0)
--> ie-ln(1.05) =~ 1.05
--> delta = 0.05
--> exact answer = 0.0488
iii. Simplifying Cobb Douglas demand function:
Q = alpha * (w/p); w = wealth
ln(Q) = ln(alpha*(w/p)) = ln(alpha) + ln(w/p) = *ln(alpha)+ln(w)=ln(P) = ln(Q)*
1. What is a dummy/binary/indicator variable?
2. What are the 2 types of data?
3. What is econometrics?
4. What are the 2 branches of statistics? correct answers 1. Takes values of 0 or 1 to indicate
whether some condition is met
0 = no
1 = yes
2. i. Experimental = researcher manipulates the values to see the effect
--> Hard to run large experiments
ii. Observational = real world observations of how variables relate to each other (most of econ)
3. Econometrics = statistical analysis + economic theory
4. 2 branches:
i. Descriptive stat (sample): presenting characteristics of a sample
ii. Inferential stat (population: guessing properties of the population
1. What is a population?
2. What is a parameter?
3. What is a sample?
4. What is a statistic? correct answers 1. Population = group of interest to researcher
2. Parameter = values from the population
3. Sample = subset of population that is available to researcher (what we look at as representative
of the population)
4. Statistic = values from the sample
1. What are the different organizations of data?
2. What are the common measures of central tendency? What do they express?
3. i.What is left skew?
ii. What is right skew?
iii. What is symmetric distribution? correct answers 1.
i. Cross Sectional- many observations observed once
ii. Time Series- single observation over time
iii. Panel data- many observations over time
2.
i. Mean, median, and mode = average, middle, most common values
ii. They express a "typical" value
3.
i. Left skew = data skewed AWAY from the left ____/\ (median > mean)
,ii. Right skew = data skewed AWAY from the right /\____ (median < mean)
--> More frequency of people with lower values than higher values!
--> ie- property values, income/wealth, etc. --> more poor people and tiny number of rich people
who accumulated wealth through theft lol
iii. Symmetric distribution = data is symmetric __/\__ (median = mean)
--> Less frequency of people with higher values than higher values!
--> ie- distribution of scores on tests
What is the Rule of 72? How is it calculated?
ie- I save money with interest rate of 6% per year. How many years until it doubles? correct
answers Quick way to calculate length of time to double something (typically money):
*72/interest rate*
ie- I save money with interest rate of 6% per year. How many years until it doubles?
Answer: 72/6 = 12 years to double
What are the 3 types of means within classical mathematics? correct answers i. *Arithmetic
mean* = sum of all observations/# of observations
--> Doesn't always work well
--> ie-to beach = 75 mph (150 mi distance; 2 hours)
-from beach = 25 mph (150 mi distance; 8 hours)
--> Total distance = 300 miles in 8 hours--> 300/8 = *actual average speed is 37.5 mph* --> this
is actually using the harmonic mean!
ii. *Geometric mean* = (product of all observations)^(1/# of observations)
--> For growth rates (R=decimal): [(1+R1)(1+R2)...(1+Rn)]^(1/n)]-1
-->) [$100(1+R1)(1+R2)(1+Rn)] = $100(1+R bar)(1+R bar)
--> Rn = decimal form
--> R bar = average interest rate
--> *1+R bar = Sq. Root N[(1+R1)(1+R2)...(1+Rn)]*
--> N = # of observations
--> ie- I'm saving for college. I put $100 into mutual fund with variable rate fo return. I gain 20%
in year 1; lose 20% in year 2. What is the average rate of return?
--> Year 1 = +20% (100 + (0.2x100) = now have $120 in account)
--> Year 2 = -20% (120 - (0.2x120) = now have $96 in account)
--> [$100(1+0.2)(1-0.2)] = $100(1+rate)(1+rate)--> 0.96 = (!+R bar)^2
iii. *Harmonic mean* = sum of all reciprocals of values/# of observations, take reciprocal of that
--> [(1/X1 + 1/X2 + ...1/Xn)/N]^(-1)
--> N = # observations
--> X = each value within N
--> Not uncommon; used for averaging ratios (ie- fuel efficiency, CPI for inflation, etc.)
,--> ie-to beach = 75 mph (150 mi distance; 2 hours)
-from beach = 25 mph (150 mi distance; 8 hours)
--> Harmonic mean = [(1/75 + 1/25)/2]^(-1) = *37.5 mph*
--> ie- Car A = 20 miles per gallon; Car B = 40 miles per gallon
Average miles/gallon = ?
--> I drive each car for 80 miles--> 160 miles total for 6 gallons total
--> 160 gallons on 6 gallons--> *avg miles/gallon = 26.69 mpg*
OR using harmonic mean:
--> [(1/20 + 1/40)/2]^(-1) = 26.69 mpg!
1. What are the intent of measures of dispersion?
2. What are the most common measures of this? correct answers 1. These statistics describe
whether values = clustered together or spread out
2. Most common measures =
i. *Standard deviation(population)/variance(sample)*:
--> Variance(u) = [(x1-mean)^2+(x2-mean)^2+(xn-mean)^2]/(N-1)
--> SD(S or Sx) = sq. rt[variance]
Advantages:
i. Includes Chebyshev's inequality = within k SDs of mean, always have at least (1-1/(k^2)) of
the sample within k SDs of mean (k being # SDs away from)
--> Within 2 SDs of mean, always have at least (1-1/(2^2)) = *3/4* of sample to be within those
2 standard deviations. that's literally it
"At least this much falls within..."
ii. Empirical rule (2/3-95-99.9 rule) =
--> Within 1 SD = approx. 2/3% falls in; 1/6 on each tail do NOT fall into the 1 SD
--> Within 2 SDs = approx. 95% falls in; 2.5% on each tail do NOT fall into the 2 SDs
--> Within 3 SDs = approx. 99.9% technically falls in; 0.15% on each end do NOT fall into 3
SDs
"Approximately how much falls within..."
iii. Standardizing values = measuring how many standard deviations you are from the mean (z
score!)
--> z = (x-mean)/standard deviation = standardized the values!
--> ie = 95th percentile = 95% fall below this score; you're in top 5%
ii. *Range*:
--> Advantages: easy to use/understand
--> Disadvantages: dependent on sample size (larger sample = larger range); determined by
unusual values (the outliers); not very useful statistically
, iii. *Interquartile range (difference between 75th + 25th percentiles of distribution)*:
--> Advantages: unaffected by sample size; determined by most common path of the population
--> Disadvantages: less convenient/easy; not very useful statistically
1) What is a logarithm?
Solve the following:
i. log3^81
ii. log2^8
iii. log2^1.41
iv. log2^0.25
2) What are the properties of the logarithm?
3) What are the applications of logarithms? correct answers 1) In theory: how many times do you
multiply x by itself to get n?
logx^k = n --> x^n = k
i.- log3^81 = 4 --> 3^4 = 81
ii.- log2^8 = 3 --> 2^3 = 8
iii.- log2^1.41 = 1/2
iv. - log2^0.25 = -2
2) Same base properties (common base = e = ~2.718 = natural logarithm = ln(x)):
i. Logb(x*y) = log(x) + log(y)
ii. Logb(x^a) = a*log(x)
iii. Logb(x/y) = log(x)-log(y)
3) Applications:
i. Find % difference:
ie- 2 values of x--> x1, x2
% difference between those values =~ ln(x2)-ln(x1)
--> x1 = 95
--> x2 = 105
% difference can also be found via...
-Midpoint method = (change in x)/(1/2(x1+x2)) = 10% change
-Elasticity (% change in Q)/(% change in P) = [(new Q-old Q)/old Q]*[old P/(new P-old P)]
ii. Approximating delta:
ln(1+delta) = ~= delta (if delta is close to 0; typically within 0.2 of 0)
--> ie-ln(1.05) =~ 1.05
--> delta = 0.05
--> exact answer = 0.0488
iii. Simplifying Cobb Douglas demand function:
Q = alpha * (w/p); w = wealth
ln(Q) = ln(alpha*(w/p)) = ln(alpha) + ln(w/p) = *ln(alpha)+ln(w)=ln(P) = ln(Q)*