100% tevredenheidsgarantie Direct beschikbaar na betaling Zowel online als in PDF Je zit nergens aan vast
logo-home
Cheat Sheet voor Midterm 1 €5,49
In winkelwagen

Overig

Cheat Sheet voor Midterm 1

 21 keer bekeken  1 keer verkocht

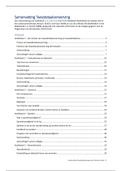
Een zeer uitgebreide cheat sheet die alle stof van mijn samenvatting op een compacte maar leesbare manier op 2 kantjes van een a4tje zet.

Voorbeeld 1 van de 2  pagina's

  • 26 februari 2024
  • 2
  • 2023/2024
  • Overig
  • Onbekend
Alle documenten voor dit vak (4)
avatar-seller
matthiaslouws
Data science pipeline: Misclassification rate is a machine-learning metric that denotes the percentage of erroneous
1. Data collection, 2. Preprocess data: Filter unwanted data: Filtering can reduce a set observations made by any classification system. The formula is as follows: Misclassification Rate =
of data based on specific criteria. For example, a table can be reduced using a threshold. Number of incorrect predictions/ Total number of predictions. Process of calculating the rate:
(df[df["column"]>500000]) or df[(df["c1"]>=3)&(df["c1"]<=5)] Aggregate data (e.g., Precision and recall can be
After making the split, devide into left and right → Individual predictions for left and right part →
sum): Aggregation reduces a set of data to a descriptive statistic. For example, a table is aggregated into F-score as a general model performance, with its best value at 1 and worst
Decide for the node if it is a good or a bad node → So for the left node, the best thing the node
reduced to a single number by computing the mean value. (e.g. the mean, value at 0.
can be is OK. (when we choose OK it made 10 mistakes) → For the right node, the best is OK.
df["column"].mean()). Group data based on a column: Grouping divides a table into How can we decide what model is better? To choose models, we need a test set, which
(when we choose OK we make 0 mistakes. → Error rate is number of incorrect predictions/total
groups by column values, which can be chained with data aggregation to produce descriptive contains data that the models have not yet seen before during the training phase.
predictions. Always pick the node that has the least amount of error rate
statistics for each group. df.groupby("province").sum() To tune hyper-parameters for a model, we use cross-validation to divide the dataset into folds
You can iteratively select the best feature for each node, until the result becomes pure.
Sort rows based on a column: Sorting rearranges data based on values in a column, which and use each fold for validation.
Entropy Suppose we have a coin: one side has the label "bad" and the other side has label "ok"
can be useful for inspection. df.sort_values(by=["column"]) Cross validation: Cross-validation is a resampling procedure used to evaluate machine
Entropy H intuitively means the averaged surprise when we flip this coin
Concatenate data frames: Concatenation combines multiple datasets that have the same learning models on a limited data sample. This allows you to prevent overfitting, and evaluate
A way to calculate the surprise is to calculate the inverse of the probability. e.g. OK has a
variables. (pd.concat([df_a, df_b])) Merge and join data frames: Merging and joining is a model performance in a more robust way than simple train-test.
probability of 0.8, so if you calculate the inverse you get a lower surprise.
common method (in relational databases) to merge multiple data tables which have Regression fits a function that maps features 𝑥 to a continuous variable 𝑦 (i.e., the
overlapping set of instances. Inner:only overlapping values from both tables,Left:everything response). Linear regression is a supervised learning algorithm that simulates a mathematical The higher the probability, the lower the surprise
from left+overlapping from right (not overlapping from right will be ignored, not overlap from relationship between variables and makes predictions for continuous or numeric variables
left will get NaN),Outer:everything from both. df_a.merge(df_b, how="inner", on="city") such as sales, salary, age, product price, etc.
Quantize continuous values into bins: Quantization transforms a continuous set of values Simple Linear Regression: regression with a single input variable. We use the single
For quantifying information, we want a small entropy. (100 OK, no bad smell). Using entropy to
(e.g., integers) into a discrete set (e.g., categories). For example, age is quantized to age variable (independent) to model a linear relationship with the target variable (dependent). We
split nodes: When splitting the parent node, we can use the averaged entropy of the leaf nodes
range. pandas.cut(df["age"], [0,20,50,200], labels=["1-20","21-50","51+"]) Scale column do this by fitting a model to describe the relationship.
to measure and quantify the information that each feature gives
values: Scaling transforms variables to have another distribution, which puts variables at the Multiple Linear Regression: if there is more than predicting variable. We can generalize
Information gain can be used to measure the reduction in uncertainty after the split
same scale and makes the data work better on many models. (e.g. z-scaling or min-max linear regression to have multiple predictors (i.e., multiple linear regression) and keep the
We have entropies of the first nodes and the final nodes, and the information gain is the
scaling) Resample time series data: You can resample time series data (i.e., the data with original mathematical representation.
difference between those nodes. We want a large information gain
time stamps) to a different frequency (e.g., hourly) using different aggregation methods Non-linear model: We can model a non-linear relationship using polynomial functions with
We can stop splitting when the information gain is too small for the best feature.
(e.g., mean). (df.resample("60Min", label=“right”).mean()). degree 𝑘.
Misclassification error as a node-splitting strategy is not a good method, because it is not sensitive
Apply a transformation function: You can apply a transformation to rows or columns in Finding the regression line Usually, we assume that the error 𝜖 is IID (independent and
to changes in probabilities and can lead to zero information gain.
the data frame. (e.g. transforming degrees to sinenotation) Def f(x): ‘if pd.isna(x): return identically distributed) and follows a normal distribution with zero mean and some variance
Combatting overfitting To combat overfitting, we can stop splitting a node when it reaches the
None ‘else: return x<5… D[“is_calm”]-D[“wind_mph”].apply(f), D["wind_sine"] = 𝜎2.To find the optimal coefficient 𝛽, we need to minimize the error using gradient descent or
maximum tree depth or does not have a minimum sample size.
np.sin(np.deg2rad(D["wind_deg"])). Use regular expressions: To extract data from text or taking the derivative of its matrix form.Error: the sum of squared errors
Another method is using the bagging technique, which is an ensemble of multiple trees, such as
match text patterns, you can use regular expression, which is a language to specify search Overfitting/underfitting Using too complex/simple models can lead to the Random Forest model. The bagging technique for the Random Forest model uses randomly
patterns. df["year"] = df["venue"].str.extract(r'([0-9]{4})'). overfitting/underfitting, which means the model fits the training set well but generalizes selected features and bootstrapped samples (samples with replacement). This helps with dealing
Drop rows or columns: We can drop data that we do not need, such as duplicate data poorly on the test set. with overfitting. Statistically speaking, the classifier we trained is one of all the possible classifiers.
records or those that are irrelevant to our research question. df['is_calm_wind'] = Overfitting occurs when the model is very complex and fits the training data very closely. We can sample many datasets D, and for all D, we can train a set of models
np.where(df['wind_mph'] < 5, True, False) Treat missing values: We can either drop the This will result in poor generalization of the model. This means the model performs well on Errors of the model that we trained can be decomposed into bias, variance and noise
rows (i.e., the records/observations) or the columns (i.e., the variables/attributes) that training data but it will not be able to predict accurate outcomes for new, unseen data. Variance: how spread out the predictions are from the true mean value of the predictions.
contain the missing values. df.dropna().sum()["C1"] Overfitting is often caused by using a model with too many parameters or if the model is too Bias: the difference between the classifiers predicted value and the true value of the parameter
We can replace the missing values (i.e., imputation) with a constant, mean, median, or the powerful for the given dataset. being predicted.
most frequent value along the same column. We can model missing values, where 𝑦 is the Underfitting occurs when a model is too simple and is unable to properly capture the Noise: systematic errors that data have. Noise is difficult to fix, so focus is on variance and bias.
variable/column that has the missing values, 𝑋 means other variables, and 𝐹 is a regression patterns and relationships in the data. This means the model will perform poorly on both the Overfitting usually comes from training a very complex model that has a high variance. Not
function. Different missing data may require different data cleaning methods. Missing Not At training and the test data. Underfitting is often caused by the model with too few parameters everything in the data is learnable, and we consider these as noise. E.g. smell reports could come
Random is a big problem and cannot be solved simply with imputation. MCAR: Missing or by using a model that is not powerful enough for the given dataset. from sources that have no obvious patterns, like a BBQ.
Completely At Random: Missing data is a completely random subset (no relations) of the Evaluation of regression models: Weak law of large numbers We can use the weak law of large numbers to reduce the variance
entire dataset. Example: Survey responses are lost due to a technical glitch during data To evaluate regression models, one common metric is the coefficient of determination (R- of a complex model. Weak law of large numbers: if we repeat the experiment for an infinite
collection, affecting participants randomly MAR: Missing at Random: Missing data is only squared, R²). R-squared represents the proportion of the variance in the dependent variable amount of times, it will get close to the real mean. For classifiers: if we have a lot of classifiers,
related to variables other than the one having missing data. Example: In a health study, that is predictable from the independent variables. R-squared value ranges from 0 to 1. A and keep training them, it will result in an average, which is close to our true mean.
smokers are less likely to disclose income information, but the missing income is still random higher R-squared value indicates that a larger proportion of the variance in the dependent That is why Random Forest works so well, it takes subsets, and for each subset it trains a decision
within the group of smokers.MNAR: Missing Not At Random: Missing data is related to the variable can be explained by the independent variables. R² = 1 means that the model tree. It takes a majority vote from all the different subsets, resulting in a number that is very
variable that has the missing data. (e.g., sensitive questions). Example: Individuals with perfectly predicts the dependent variable based on the independent variables. R² = 0 means close to the true mean. Bagging is one of the ensemble learning methods, where multiple weak
higher incomes are less likely to share details about the frequency of psychiatric treatments that the model does not explain any variability in the dependent variable. classifiers are combined into a stronger classifier using various techniques.
in a mental health survey, creating a non-random pattern in the missing data. Explore data: SSTO is the "total sum of squares" and quantifies how much the data points y vary around Can be achieved using al lot of different models, not only Decision Tree
Plotting the data, creating interactive visualisations, etc. Model data: Modeling structured, their mean ȳ. SSR is the "regression sum of squares" and quantifies how far the estimated Evaluation of the Random Forest model: To evaluate models, we first compute true positives
text, and image data through three modules from a practical point of view. Examples: Image sloped regression line ŷ is from the horizontal "no relationship line," the sample mean or ȳ. (TP), false positives (FP), and false negatives (FN) for smell events. We apply time series cross-
classification: optical character recognition, such as recognizing digits from hand-written If regression line fits the data perfectly, SSres will be very small. validation of several pairs of training and testing sets to evaluate the model performance.
images, or fine-grained categorization, such as categorizing the types of birds. Text SSE is the "error sum of squares" and quantifies how much the data points y vary around the Cross validation: Cross-validation is a resampling procedure used to evaluate machine learning
classification: sentiment analysis, such as identifying emotions from movie reviews, or estimated regression line ȳ . Formula: models on a limited data sample. For example, in K-fold-Cross-Validation, you need to split your
annotating paragraphs, such as categorizing the research aspect for each fragment in the dataset into several folds, then you train your model on all folds except one and test model on
paper abstract. Deploy models: Deploying models in the wild can enable further quantitative R² increases as we add more predictors (because the optimization always want to decrease remaining fold. You need to repeat this steps until you tested your model on each of the folds and
or qualitative research with insights, such as the push notification study in Smell Pittsburgh. the residual sum of squares) and thus is not a good metric for model selection. We need the your final metrics will be average of scores obtained in every fold. This allows you to prevent
adjusted R², which considers the number of predictors. overfitting, and evaluate model performance in a more robust way than simple train-test.
Classification Classification is a supervised machine learning method where the model tries Adjusted R-squared is a modified version of R-squared that has been adjused for the .
to predict the correct label of a given input data.Example: identifying whether a text message number of predictors in the model. The adjusted R-squared increases when the new term
is spam or ham (non-spam). improves the model more than would be expected by chance. It decreases when a predictor Overig
To classify spam messages, we need examples: a dataset with observations (messages) and improves the model by less than expected. Formula: Precision: how likely is a prediction going to be true every time, high value =reliable prediction.
labels (spam or non-spam). We can extract features (information) using human knowledge, Recall: how many spam messages did the algorithm catch, if it’s 1, we did not miss any spam
which can help distinguish spam and ham messages. E.g. the amount of special characters messages. E.g., did we catch all tumors? F-score as a general model performance, best value =1,
and digits. Using features 𝑥 (which contains 𝑥! and 𝑥"), we can represent each message as N is the number of points in your data sample. K is the number of independent regressors, worst=0.
one data point on an 𝑝-dimensional space (𝑝 = 2 in this case). i.e. the number of variables in your model, excluding the constant. Decision Tree can be trained well using entropy as the node-splitting strategy.
We can think of the model as a function 𝑓 that can separate the observations into R² is larger for the model with more predictors (i.e., the cubic model that has three Categorical: Categorical variables represent categories or groups, e.g. gender or colors.
groups (i.e., class labels 𝑦) according to their features 𝑥 = {𝑥!, 𝑥"}. To find a good predictors). The adjusted R², which considers the number of predictors (model complexity), Continuous: Continuous variables can take on an infinite number of values within a given range.
function 𝑓, we start from some 𝑓 and train it until satisfied. We need something to tell us favors the the square-root model. Be careful when using and explaining 𝑅 in your findings. A E.g. height, weight.
which direction and magnitude to update. First, we need an error metric (i.e., cost or bad R² does not always mean no pattern in the data. A good R² does not always mean that Window operations: Imagine you have a sequence of numbers, like [1, 2, 3, 4, 5, 6, 7, 8, 9].
objective function). For example, we can use the sum of distances between the misclassified the function fits the data well. And R² can be greatly affected by outliers. Now, a rolling function in Python allows you to take a "window" of a certain size and perform an
points and line 𝑓. Error metric = the sum of the distance to the line for each misclassified Decision Tree Unlike the linear classifier (which has a linear decision boundary), Decision operation on that window as it moves through the sequence.For instance, let's say you want to
point. Loss Function: how predictions deviates from actual results. Tree has a non-linear decision boundary that iteratively partitions the feature space. calculate the average (mean) of three consecutive numbers at a time. You start with the first
Cost Function: It is the average error for all the records in the training set calculated by the Decision Tree also works on continuous features. A method is to put the values into bins, and three numbers [1, 2, 3], calculate their mean (which is 2), then you move the window by one
loss function. We can use gradient descent (an optimization algorithm) to minimize the error treat each bin as a categorical value. (e.g. work for <10 min, work for > 20min) position to the right [2, 3, 4], calculate their mean (which is 3), and so on.The rolling function
to train the model 𝑓 iteratively. Depending on the needs, we can train different models (using Node-splitting strategies: Misclassification error rate helps you perform such operations on a "rolling" or moving window of elements in your data
different loss functions) with various shapes of decision boundaries. We have a lot of questions(nodes), but what question will give you the best information? sequence. It's useful for tasks where you want to analyze data in chunks or smooth out
Classification model evaluation To evaluate our classification model, we need to compute Suppose we want to compare two features when predicting bad smell. How can we quantify fluctuations. # Calculate the rolling mean with a window size of 3 rolling_mean =
evaluation metrics to measure and quantify model performance, such as the accuracy of all which feature gives the most information? Right is better. If the node is pure, you dont df['value'].rolling(window=3).mean() Vectors: Before feeding data into a machine-learning
data. For imbalanced data, the accuracy of all data is a bad evaluation metric. Imbalanced have to continue splitting the tree. If you keep splitting a node that is not convincingly true, model, it is “vectorized” — converted into numbers representing a point or point sequence in the
data: some classes have far less data. Instead of computing the accuracy for all the data, we you may end up overfitting the model. vector space. The vectors in machine learning signify input data, including bias and weight. In the
can compute accuracy for each class, which allows us to see the performance of different same way, output from a machine-learning model (for example, a predicted class), can be put into
labels. If we care more about the positive class (e.g., spam), we can use precision and recall, vector format. Matrices: A matrix is a rectangular array of numbers. Those numbers are
with its best value at 1 and the worst value at 0 TN: Instances correctly predicted as the contained within square brackets. In other words, a matrix is a 2-dimensional array, made up of
negative class TP: Instances correctly predicted as the positive class. FP: Instances rows, and columns. The numbers contained in the matrix, or the matrix elements, can be data
incorrectly predicted as the positive class (false alarm). FN: Instances incorrectly predicted as from a machine learning problem, such as feature values. We can map vector and matrix forms to
the negative class (miss). data directly.

Voordelen van het kopen van samenvattingen bij Stuvia op een rij:

Verzekerd van kwaliteit door reviews

Verzekerd van kwaliteit door reviews

Stuvia-klanten hebben meer dan 700.000 samenvattingen beoordeeld. Zo weet je zeker dat je de beste documenten koopt!

Snel en makkelijk kopen

Snel en makkelijk kopen

Je betaalt supersnel en eenmalig met iDeal, creditcard of Stuvia-tegoed voor de samenvatting. Zonder lidmaatschap.

Focus op de essentie

Focus op de essentie

Samenvattingen worden geschreven voor en door anderen. Daarom zijn de samenvattingen altijd betrouwbaar en actueel. Zo kom je snel tot de kern!

Veelgestelde vragen

Wat krijg ik als ik dit document koop?

Je krijgt een PDF, die direct beschikbaar is na je aankoop. Het gekochte document is altijd, overal en oneindig toegankelijk via je profiel.

Tevredenheidsgarantie: hoe werkt dat?

Onze tevredenheidsgarantie zorgt ervoor dat je altijd een studiedocument vindt dat goed bij je past. Je vult een formulier in en onze klantenservice regelt de rest.

Van wie koop ik deze samenvatting?

Stuvia is een marktplaats, je koop dit document dus niet van ons, maar van verkoper matthiaslouws. Stuvia faciliteert de betaling aan de verkoper.

Zit ik meteen vast aan een abonnement?

Nee, je koopt alleen deze samenvatting voor €5,49. Je zit daarna nergens aan vast.

Is Stuvia te vertrouwen?

4,6 sterren op Google & Trustpilot (+1000 reviews)

Afgelopen 30 dagen zijn er 53068 samenvattingen verkocht

Opgericht in 2010, al 14 jaar dé plek om samenvattingen te kopen

Start met verkopen
€5,49  1x  verkocht
  • (0)
In winkelwagen
Toegevoegd