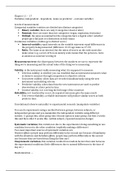
Chapter 1.1 – 1.7
Variables; independent - dependent, (same as predictor – outcome variable)
Levels of measurement;
Categorical variables (entities are divided into distinct categories)
Binary variable; there are only 2 categories (dead or alive)
Nominal; there are more than two categories (vegan, vegetarian, fruitarian)
Ordinal; the same as nominal but the categories have a logical order (whether
people got a fail pass or a distinction in their exam)
Continuous variables (entities get a distinct score)
Interval variable; equal intervals on the variable represent equal differences in
the property being measured (difference 13-15 age same as 17-19)
Ratio; The same as an interval, but the ratios of scores on the scale must also
make sense (e.g. a score of 8 on an anxiety scale means that the person is, twice
as anxious as someone scoring 4)
Measurement error: the discrepancy between the numbers we use to represent the
thing we’re measuring and the actual value of the thing we’re measuring.
Validity; is the instrument really measuring what it is supposed to measure
Criterion validity; is whether you can establish that an instrument measures what
is claims to measure through comparison to objective criteria
Concurrent validity; when data are recorded simultaneously using the new
instrument and existing criteria
Predictive validity; when data from the new instrument are used to predict
observations at a later point in time
Content validity; is it covering the full range of the construct
Reliability; is it trustworthy or not, do repeated outcomes give the same result.
Test-retest reliability; a reliable instrument will produce similar scores at both
points in time.
Correlational (observe naturally) vs experimental research (manipulate variables)
You can do experiments using a method between groups, between subjects, or
independent groups and you manipulate the independent variable using different
entities. (1 groups this, other group this) Second option is same group, but first 2 weeks
this and then other 2 weeks this. (within subject, repeated measures design)
Systematic variation; this variation is due to the experimenter doing something in one
condition but not in the other condition (explicitly making a difference)
Two most important sources of systematic variation are;
Practice effects (people may perform differently in the second one because of familiarity
with the situation) and boredom effects, people may perform differently in the second
one because they are bored from doing the first one)
Unsystematic variation; this variation results from random factors that exist between
the experimental conditions (little differences due to natural differences in the time of
day etc.)
Randomization ….
, (PP) Ways to quantify the centre of a distribution;
Mode; the score that occurs most frequently in the data set (N,O,I,R)
Median; the middle score when ranked in order of magnitude (O,I,R)
Mean; the average score (I,R)
(PP) Dispersion of a distribution;
Range; the difference between the largest and lowest number (O,I,R)
Interquartile range; the range of the middle 50% of the scores (O,I,R) (median)
Lower quartile; the median of the lower half of the data
Deviance: difference between each score and the mean
Variance: the average dispersion (I,R) (mean)
Standard deviation: the square root of the variance (I,R) (mean)
(PP) Probability distribution for the normal distribution is the bell shape (first low, high,
low) -> Mean and median are equal, random variable has an infinite range
(PP) Z scores say something about the relative positive of a certain observation
Z = X – X’ ; S (Standard deviation)
How many SD the outcome is away from the mean
If done with all variables, results in a new standardized variable with a mean of 0 and SD
of 1
M is mean for APA (could be X as well), SD is standard deviation, N entire sample, Mdn is
median, IQR is interquartile range
4.4 – 4.5
……
2.1 – 2.5
(PP) Outcome = (model) + error
Parameters; are estimated from the data, and are constants believe to represent some
fundamental truth about the relations between variables in the model (mean, median
and correlation and regression coefficients (which estimate the relationship between 2
variables))
Parameter mostly used as letter b
Outcome = (b) + error, or outcome = (bXi) + error
Deviance = outcome – model
Total error = sum of errors = Z (outcome-model)
(PP) Total sum of squared errors = Z (outcome – model)’2
Average error = Z (outcome – model)’2 ; N -1
(PP) Confidence intervals; boundaries within which we believe the population will fall
A confidence interval for the mean is a range of scores constructed such that the
population will fall within this range in 95% of samples.
(PP) z-values; large samples, t-values; small samples, sigma is unknown, n-1
Z value; Alpha ; 2
Standard error of the mean = ST : Square root of N