100% tevredenheidsgarantie Direct beschikbaar na betaling Zowel online als in PDF Je zit nergens aan vast
logo-home
Statistics 1 Summary for EXAM €5,49
In winkelwagen

Study guide

Statistics 1 Summary for EXAM

2 beoordelingen
 105 keer bekeken  11 keer verkocht

This document contains a detailed summary of my lecture notes from the Statistics I course. With this summary, I scored an 8.5 in my exam.

Voorbeeld 4 van de 39  pagina's

  • 21 oktober 2020
  • 39
  • 2019/2020
  • Study guide
book image

Titel boek:

Auteur(s):

  • Uitgave:
  • ISBN:
  • Druk:
Alle documenten voor dit vak (4)

2  beoordelingen

review-writer-avatar

Door: veerleschurgers • 2 jaar geleden

review-writer-avatar

Door: jjdwumfour • 1 jaar geleden

avatar-seller
polscinotes
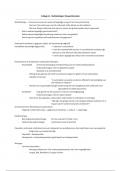
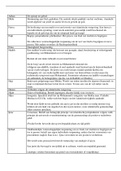
STATISTICS 1 – DESCRIPTION AND INFERENCE


WEEK 1: Distributions, means and deviation

Variable: anything that can be measured and can differ across entities or across time
1. Independent variables: Cause (x)
2. Dependent variables: Outcome (y)

Levels of measurement (categorical)
Nature of information within values assigned to variables

1. Nominal
• Two or more exclusive categories
• No natural order
• No arithmetic operations possible (subtraction, “equal to”, “greater than”)
• Frequency (mode)
• Occupation, political party affiliation, favorite football club
2. Ordinal
• Clear ordering of the variables
• Low <-> high; little <-> much; small <-> large
• Spacing between values not the same across the levels of the variables
• Level of agreement, level of education, political interest, trust in government
3. Interval
• Difference between two values meaningful
• Arbitrary/meaningless zero
• Temperature, pH (more examples in natural sciences)
4. Ratio
• Like interval but meaningful zero
• Height, weight, salary, Kelvin, number of international conflicts

Continuous variables – interval and ratio
Continuous variables (interval-ratio) are continuous but can be discrete.

o Continuous interval-ratio variables
• Can be measured to any level of precision
• Height or weight: 75.329242… cm
o Discrete interval-ratio variables
• Can take only certain, countable values (usually whole numbers)
• Points in an exam or number of car accidents at an intersection
• Discrete variables can be measured in discrete terms (height in cm)

,What can you do?

Possible to… Nominal Ordinal Interval Ratio
Frequency distribution? YES YES YES YES
Median and percentiles? NO YES YES YES
Add or subtract? NO NO YES YES
Mean, standard NO NO YES YES
deviation, standard error
of the mean?
Ratio, or coefficient of NO NO NO YES
variation?


I. DISTRIBUTION
To show how data values are distributed in relation to other values.

> Frequency distribution: the distribution of a statistical data set to show all the possible
values (or intervals) of the data and how often they occur.

Measure of central tendency
A value that attempts to describe a set of data by identifying the central position within that
set of data

Level of measurement Measures of central tendency
Nominal Mode
Ordinal Median + Mode
Interval and ratio Mean + Median + Mode


MODE: the most frequent score in a data set (there can be several modes)

MEDIAN: the middle score for a set of data that has been arranged in order of magnitude
o Odd number of scores: Arrange by magnitude to find median.
o Even number of scores: Arrange by magnitude, add 2 middle scores, divide by 2

MEAN: the average of the numbers

1. Calculate the sum of all values of x
2. Divide by the total number of observations (n)

&
Σ ' = 1)*
!" =
&

Mean is sensitive to extreme values/outliers
When there are extreme values, the median may be more useful

,Measure of dispersion
How stretched or squeezed is the distribution?

Level of measurement Measures of dispersion
Nominal No measure of dispersion possible
Ordinal Range, inter-quartile range
Interval and ratio Range, inter-quartile range,
variance/standard variation

RANGE: maximum - minimum

INTERQUARTILE RANGE: The range of the middle 50% of the data.

Calculate by subtracting the first quartile from the third quartile.


Even set of numbers?
1. Split the data in two halves
2. Find the median of the lower half
3. Find the median of the upper half
4. Calculate IQR = 57 – 35 = 22


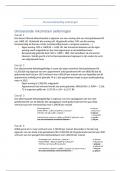
VARIANCE AND STANDARD DEVIATION
Measure the spread using all data

DEVIANCE: How much does each value deviate from the mean?

+,-'.&/, = )* − )̅

Total deviance (sum of all deviances) is always zero.

&
2 = 1()* − )̅ )
'

, EXAMPLE: Number of points of students in a test

Adam Abby Dan Elsa Isan Liz Max Pat Tom Uma Zev
14 35 45 55 55 56 57 65 87 89 92

Step 1. Calculate the MEAN (column 2)
∑6*78 )*
!" =
&
89:;<:9<:<<:<<:<=:<>:=<:?>:?@:@A =<B
!" = 88
= 88
= 59.09

Step 2. Calculate all DEVIANCES (column 3)

Step 3. Square all the deviances (errors) (column 4) – SQUARED ERRORS

Step 4. Add the squared deviances – SUM OF SQUARED ERRORS (SS)
6
∑ = 1()* − )̅ )A = 5650.91
*


x )̅ ()* − )̅ ) ()* − )̅ )A
14 59.09 14 - 59.09 = -45.09 (−45.09)A = 2033.19
35 59.09 35 - 59.09 = -24.09 (−24.09)A = 580.37
45 59.09 45 - 59.09 = -14.09 (−14.09)A = 198.55
55 59.09 55 - 59.09 = -4.09 (−4.09)A = 16.74
56 59.09 56 - 59.09 = -3.09 (−3.09)A = 9.55
57 59.09 57 - 59.09 = -2.09 (−2.09)A = 4.37
65 59.09 65 - 59.09 = 5.91 (5.91)A = 34.92
87 59.09 87 - 59.09 = 27.91 (27.91)A = 778.92
89 59.09 89 - 59.09 = 29.91 (29.91)A = 894.55
92 59.09 92 - 59.09 = 32.91 (32.91)A = 1038.01
5650.91

Step 5. Calculate the VARIANCE (K A )

LL ∑6*78()* − )̅ )A
KA = =
M−1 M−1

LL 5650.91 5650.91
KA = = = = OPO. QR
M−1 11 − 1 10

Step 6. Calculate STANDARD DEVIATION (s)

K = SK A
K = SK A = √565.09 = UV. WW

Voordelen van het kopen van samenvattingen bij Stuvia op een rij:

Verzekerd van kwaliteit door reviews

Verzekerd van kwaliteit door reviews

Stuvia-klanten hebben meer dan 700.000 samenvattingen beoordeeld. Zo weet je zeker dat je de beste documenten koopt!

Snel en makkelijk kopen

Snel en makkelijk kopen

Je betaalt supersnel en eenmalig met iDeal, creditcard of Stuvia-tegoed voor de samenvatting. Zonder lidmaatschap.

Focus op de essentie

Focus op de essentie

Samenvattingen worden geschreven voor en door anderen. Daarom zijn de samenvattingen altijd betrouwbaar en actueel. Zo kom je snel tot de kern!

Veelgestelde vragen

Wat krijg ik als ik dit document koop?

Je krijgt een PDF, die direct beschikbaar is na je aankoop. Het gekochte document is altijd, overal en oneindig toegankelijk via je profiel.

Tevredenheidsgarantie: hoe werkt dat?

Onze tevredenheidsgarantie zorgt ervoor dat je altijd een studiedocument vindt dat goed bij je past. Je vult een formulier in en onze klantenservice regelt de rest.

Van wie koop ik deze samenvatting?

Stuvia is een marktplaats, je koop dit document dus niet van ons, maar van verkoper polscinotes. Stuvia faciliteert de betaling aan de verkoper.

Zit ik meteen vast aan een abonnement?

Nee, je koopt alleen deze samenvatting voor €5,49. Je zit daarna nergens aan vast.

Is Stuvia te vertrouwen?

4,6 sterren op Google & Trustpilot (+1000 reviews)

Afgelopen 30 dagen zijn er 52510 samenvattingen verkocht

Opgericht in 2010, al 14 jaar dé plek om samenvattingen te kopen
Start met verkopen
€5,49  11x  verkocht
  • (2)
In winkelwagen
Toegevoegd