Video 1: basic statistical analysis
Screening the dataset:
1. No missing values
2. Logical values?
3. Reverse coding
If the data is ready:
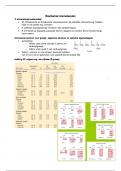
1. Describe and summarize data → descriptive analysis (frequencies, percentage, mean std
dev,
Inferential analysis:
- Hypotheses testing
- Compare means → one sample T-test
- T-value = (mean sample-mean test value)/ std.error mean → must be >2 (critical value)
Differential analysis
- Hypotheses testin
- Compare means
- Independent Samples > 2 → one way ANOVA
1. Related sample → comparing response of the same individual, amongst each other
→ paired sample T-test
2. Chi-square test → comparing the means of non-metric variables (nominal, bv age) if
P<0.05, reject H0 → the difference between the means is significant
Associative analysis
- Checking correlations between variables
- Magnitude of the correlation coefficient (R ), magnitude, and significance
- Pearson’s correlation → negative: the greater the household size, the lower the evaluation
- Pearson’s correlation → between 0.1-0.3 = weak, 0.3-0.5 =medium, >0.5=strong
Video 2: Scale Analysis case
Factor analysis:
- KMO’s and Barletts test → whether it is appropriate to conduct factor analysis
(intercorrelations between variables)
→ KMO > 0.5
→ significance > 0.05
- Total variance explained → Look at EigenValues > 1 → this is the amount of factors (max
of 5 factors)
- How much of the variance is captured by the factors loading
- Communalities table: >0.3, lower amount of factors, lower number for communalities
- Rotated component matrix: >0.5, must load on high on 1 factor and low on the others
→ if item does not group together with other items on same factor, or <0.5 → exclude
item
Task 2: Reliability assessment
, - Group the items that load on the factor together
- Cronbachs alpha > 0.7
- Look at Cronbachs alpha if item deleted → if it doesn’t go up, accept the cronbachs alpha
as it is
- If alpha > 0.7, but it goes up if item deleted → don’t delete that item → the more items
you give up, the more the validity will go down
Task 3: Compute mean scores on dimensions (summated scales)
- Compute the mean scores of the items that are grouped together
- You can do for example regression with these new variables → for multicollinearity
Video 3: Market Response model
To measure the impact of different marketing inputs on consumer demand
→ test whether the marketing actions had any effect on sales
→ evaluate the marketing actions
→ what-if to develop future market decisions
1. Analyze trends and relationships among variables
→ trends: plot per variable
→ relationships among variables: scatterplot
2. Run regression analysis using different models
- Model fit: Adjusted R squared → the model explains (r2) of the variance of the DV
- Coefficient table: Sig <0.05
→ B: For every unit increase in price, the sales increases by (b value) holding everything
else constant
- Model fit opt 2: Sales vs predicted sales
→ Predicted sales = a + b1price + b2Ad + error
→ A= constant, b1 = b value price, b2= b value Ad, error =unknown
→ the value of price and ad are given
→Residual Error is the difference between actual and predicted sales
- Weak fit of model → create new model → cummulated advertising spend
→ regression with CummAd as new IV
- Collinearity statistics:
→ Tolerance > 0.1
→ VIF < 10
- Which IV has a greater impact on the DV → standardized coefficient Beta → the
highest value has the largest impact on the DV (look at absolute values)
- When you find the best model fit → what -if simulations to guide future marketing
decisions
→ what happens if you stop advertising after one year?
→ what happens if you increase advertising budget with 50%?
Voordelen van het kopen van samenvattingen bij Stuvia op een rij:
Verzekerd van kwaliteit door reviews
Stuvia-klanten hebben meer dan 700.000 samenvattingen beoordeeld. Zo weet je zeker dat je de beste documenten koopt!
Snel en makkelijk kopen
Je betaalt supersnel en eenmalig met iDeal, creditcard of Stuvia-tegoed voor de samenvatting. Zonder lidmaatschap.
Focus op de essentie
Samenvattingen worden geschreven voor en door anderen. Daarom zijn de samenvattingen altijd betrouwbaar en actueel. Zo kom je snel tot de kern!
Veelgestelde vragen
Wat krijg ik als ik dit document koop?
Je krijgt een PDF, die direct beschikbaar is na je aankoop. Het gekochte document is altijd, overal en oneindig toegankelijk via je profiel.
Tevredenheidsgarantie: hoe werkt dat?
Onze tevredenheidsgarantie zorgt ervoor dat je altijd een studiedocument vindt dat goed bij je past. Je vult een formulier in en onze klantenservice regelt de rest.
Van wie koop ik deze samenvatting?
Stuvia is een marktplaats, je koop dit document dus niet van ons, maar van verkoper fabianhamers. Stuvia faciliteert de betaling aan de verkoper.
Zit ik meteen vast aan een abonnement?
Nee, je koopt alleen deze samenvatting voor €6,49. Je zit daarna nergens aan vast.