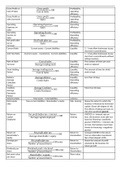
A single page summarising the financial indicators required for the company analysis section of the Grade 12 NSC Accounting examinations. The summary includes a section of how to provide appropriate comments for each financial indicator.
Gross Profit on Gross profit Profitability,
∗100
Cost of Sales Cost of Sales operating
efficiency
Gross Profit on Gross profit Profitability,
∗100
sales (turnover) Sales operating
efficiency
Operating Operating Expenses Operating
∗100
Expenses on Sales efficiency
Sales
Operating Operating Income Profitability,
∗100
Income on Sales Operating
Sales efficiency
Net profit after Net Profit after tax Profitability,
∗100
tax on Sales Operating
Turnover efficiency
Current Ratio Current assets : Current liabilities Liquidity 2 : 1 may allow businesses to pay
short term commitments
Acid Test Ratio (Current assets – inventories) : Current Liabilities Liquidity 1 : 1 may allow businesses to pay
short term commitments without
selling inventory
Rate of Stock Cost of sales Liquidity, The number of times per year
Turnover Average trading stock Operating stock is replaced
efficiency
Stock Holding Average trading stock Liquidity, The amount of time for which
∗365
Period Cost of Sales Operating stock is kept
efficiency
Debtors Average debtors Liquidity, Less than 30 days
∗365
Average Credit Sales Operating
Collection efficiency
Period
Creditors Average Creditors Liquidity, More than 60 days
∗365
Average Credit Purchases Operating
Payments efficiency
Period
Solvency Ratio Total assets : Total liabilities solvency
Debt-equity Non-current liabilities : Shareholder’s equity Risk, Gearing Shows the extent to which the
ratio business is financed by borrowed
capital. Shows the degree of risk.
The effects of taking out loans on
risk when positively geared.
Return on Net profit before tax∧interest Return, If ROTCE is > interest rate on
∗100
Capital Average capital employed Gearing loan, the business must take out
Employed loans for financing = positively
geared. If ROTCE is < interest rate
on loan, the business must issue
shares for financing = negatively
geared.
Return on Net profit after tax Return to Compare ROSHE to the return
Shareholder’s
∗100 shareholders from an alternative investment
Average shareholde r ' equity
equity like a fixed deposit at 8%.
Earnings per Net profit after tax Return to Shows the amount of profit
∗100 cents
share Number of issued shares shareholders retained by the business for
future growth
Dividends per Dividends paid∧declared Return to
∗100 cents
share Number of issued shares Shareholders
Net asset value Shareholde r ' s equity Share value
per share ∗100 cents
Number of issued shares
The benefits of buying summaries with Stuvia:
Guaranteed quality through customer reviews
Stuvia customers have reviewed more than 700,000 summaries. This how you know that you are buying the best documents.
Quick and easy check-out
You can quickly pay through EFT, credit card or Stuvia-credit for the summaries. There is no membership needed.
Focus on what matters
Your fellow students write the study notes themselves, which is why the documents are always reliable and up-to-date. This ensures you quickly get to the core!
Frequently asked questions
What do I get when I buy this document?
You get a PDF, available immediately after your purchase. The purchased document is accessible anytime, anywhere and indefinitely through your profile.
Satisfaction guarantee: how does it work?
Our satisfaction guarantee ensures that you always find a study document that suits you well. You fill out a form, and our customer service team takes care of the rest.
Who am I buying this summary from?
Stuvia is a marketplace, so you are not buying this document from us, but from seller ETheron. Stuvia facilitates payment to the seller.
Will I be stuck with a subscription?
No, you only buy this summary for R55,00. You're not tied to anything after your purchase.