AQUACULTURE AND FISHERIES
ECOLOGY THEME
FISH COMMUNITIES IN RELATION TO ENVIRONMENTAL CHARACTERISTICS
Aquatic food webs
Feeding relationships between animals can be described with trophic
levels, e.g. a trophic pyramid in which producers are at the bottom
(so they are the largest group) and contain the largest part of energy;
then you have primary, secondary and tertiary consumers as you go
to the top which contain smaller and smaller amount of energy.
However, consumers often change trophic levels in their life cycle
(e.g. a larval fish can eat algae and bacteria in the first stages of life,
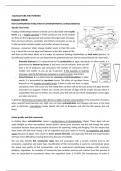
and then eat fish when adult) so it is better to represent feeding relationships as food webs (picture). At
the different trophic levels, we can determine the potential biomass and the actual biomass of a food web:
- Potential biomass à it is determined by the productivity of algae and plants; in other words, it is
determined by bottom-up forces. If you have a lot of nutrients, then you will
have a lot of producers and consumers; the number of consumers will be
smaller and smaller as you go up. In general, if the quantity of nutrient
increases, also the fish biomass increases in a water system. See picture
- Actual biomass à it is determined by consumer-control/predation; in other
words, it is determined by top-down forces. The effect of top-down forces
depends on the number of trophic levels: if there is only one level, so algae
and plants, there will not be any fish eating them so there will be the max amount of algae that the
ecosystem can support; if there are 2 levels, the amount of algae will be smaller because there is
zooplankton that eats it; if there are 3 levels, prey fish will eat part of the zooplankton so less algae
are eaten and so on.
In general, fish biomass increases when there is a higher nutrient concentration in the ecosystem. However,
when nutrient levels become very high, you can have eutrophication and changes will occur in the food
web. In particular, macrophytes (water plants) will start to disappear and also the fish species that eat
them.
Water quality and fish community
In shallow lakes, eutrophication causes a predominance of phytoplankton (algae). These algae will use
most sunlight so other macrophytes (water plants) cannot grow anymore and this will change the entire
ecosystem because these plants provide structures for spawning, hiding and foraging. This also means that
these lakes will shift from having a lot of vegetation and clear water to having no vegetation and turbid
water (because of algae). This results in lower species diversity, and especially fish that are visual hunters
will have more difficulties in seeing their preys because of turbidity.
We can also identify fish community types that are associated with a certain nutrient level in the
ecosystem, vegetation and water type. Classification of fish communities is useful to communicate about
the status and quality of fish communities, and to understand relationships between fish, nutrients,
plankton, vegetation. An example of community type includes perches and roaches (two fish species) à
they are associated to ecosystems where the vegetation cover is 10-60%, the transparency of water is
,>100cm and the biomass is 10-100kg/ha. NB: fish has an effect on transparency of water, because certain
species dig at the bottom and raise sand, making water more turbid.
Ecological guilds à fish species that have similar ecological functioning can be also classified into ecological
guilds, in particular depending on their water flow preference, reproduction ecology and diet. E.g., all
species that are detritivores are classified in one guild. Table 4.1 of ecology lecture notes gives all
classifications.
Alternative stable states and biomanipulation
Alternative stable states à these are states that are self-reinforcing, or that keep each other in balance. An
example is again with algae and water plants: high nutrient levels = too much algae = eutrophication and
turbidity; low nutrient levels = low algae and more water plants = clear water; however, if the nutrient level
is intermediate, both water plants and algae can exist together. These two states are an example of
alternative stable states.
Biomanipulation à it is a method consisting in manipulating the food web to change feedback loops in the
ecosystem. For example, it can be used to remove algae in lakes where eutrophication occurs. A method
used in the NL was to massively remove zooplanktivorous and benthivorous fish. This leads to more
zooplankton (because the fish that eats it was removed) that eats algae, so algae will be removed, water
becomes clearer and water plants can grow again.
River characteristics and fish communities
River Continuum Concepts RCC à in summary it says that since rivers extend over long distances, the biotic
and abiotic components of each part of the river are different from each other, so also the population in
the river changes, as well as the use and storage of organic matter. For example, a part of the river might
have human activities, while in another part no human activities are present so the shore will have more
trees. Consequently, not much photosynthesis occurs in this part and most energy is derived from leaf
material from these trees. Also, some parts of a river are wider so water velocity becomes lower and it is
more turbid, so species in that part are different from those in parts with higher water velocity.
Since species change in different parts of a river, a classification of “fish zones” has been developed
in which a certain species is linked to certain river characteristics. For example, a fish zone is “Trout” that
includes mainly trouts, bullheads and minnows, which is linked to type of river with mountain brooks with
waterfalls, not very deep and clear water with low nutrient concentration (table 6.1 ecology notes). This
classification is very useful, but has some problems:
- Zonation is difficult to use in practice because it is based on natural rivers, but nowadays almost all
rivers have a human influence.
- Zonation is based on the adult stage of fish, but it might be different when they are larvae or
juvenile.
- Zonation only takes into account the length dimension of the river, and not the width or time
aspects.
- Zonation only includes species from north-western Europe so it cannot be applied to all rivers.
Flood Pulse Concept FPC à it focuses on the ecological processes in the lateral direction of the river, and
especially the interaction of the river with its floodplains. The FCP says that “the rise and draw-down of
water on the floodplain enhances biological productivity and maintains diversity in the system”.
, In periods without floods, the floodplain maintains its own nutrient cycle because it is not affected
much by water. During floods, nutrients and river organisms are sent over the floodplain so there is a
strong interaction between aquatic and terrestrial zones, which are called Aquatic-Terrestrial Transition
Zones ATTZ. During floods, the matter that was mineralised on the floodplain can dissolve in water and is
available for aquatic organisms. Many organisms have adapted to this flood pulse, and use it to their
advantage for example to spawn. However, in many rivers the natural flood pulse is altered by changes in
land use, river regulation, canalisation and in general because of changing hydrology (because of climate
change). This leads to the loss of floodplain wetlands and therefore loss of biodiversity and natural resource
production, especially fish.
There are also differences in water and river bottom composition between the central part of the
river and the part closer to the floodplain à in the central part, water is faster with higher O2
concentration, colder water and sand/clay bottoms; near the floodplain, water is more stagnant with silt
and organic deposits, and with periodic O2 deficit and higher temperatures.
The effect of river changes on the fish communities
Various fish species have been affected by human disturbance. Especially ecological guilds of specialised
species that are adapted to specific riverine conditions have reduced a lot more, compared to generalist
species that can survive a wider range of habitats.
Because of dams and sluices, migratory river fishes have become extinct or very rare. Non-migratory fishes
have become rare because their lotic habitats (fresh water that moves fast) have degraded or disappeared.
Limnophilic fish, which depend on clear water with aquatic plants also became rare, mainly because of
eutrophication. Eurytopic fish (=able to tolerate many habitats) have become dominant everywhere.
THE ROLE OF FISH IN INTEGRATED WATER MANAGEMENT
Fish as indicators for ecological water quality
Fish are an important source of food, are used for recreation (sport fisheries), as ornamentals and as study
subjects. Another important function of fish is to be indicators of ecological water quality and of the
biological integrity of ecosystems. These indicators are important to monitor
(following developments in time) and classification (distinguishing between
water bodies).
Ecological water quality and the EU Water Framework Directive (WFD)
The WFD was adopted by the EU in 2000 as part of the European water
legislation, which provides a framework for the protection, improvement and
sustainable use of all water bodies in Europe. The main goal of the WFD is to
protect and improve the water environment, preventing the deterioration of
ecosystems and if possible restoring water damaged by pollution, water
abstraction, dams and engineering activities.
With the WFD, the ecological water quality is divided into 5 classes: bad, poor, moderate, good and
high. Now the question is “How do we measure quality and how do we decide what is good or bad?”. To
answer this, the WFD uses “quality elements” for physico-chemical, hydromorphological and biological
characteristics of water bodies. For these quality elements, the high, good and moderate state are
,described by the WFD (Vedi anche table 7.1 ecology notes come esempio). The biological quality elements
include:
- Phytoplankton
- Macrophytes (water plants) and phytobenthos (plants living at the bottom of the sea/lake/river)
- Benthic invertebrate fauna (organisms that live at the bottom)
- Fish fauna. For the fish fauna there are certain variables to be measured:
o Species composition
o Abundance
o Age structure (how many fish are adult, how many juvenile or larvae)
o Presence of sensitive species
This gives and indication of what should be measured to determine ecological water
quality.
What are indicators?
Indicators = measures that summarise the key elements of a complex ecosystem, and that
are used to evaluate the condition of the ecosystem. Indicators help monitor changes in the
ecosystem and also help communication of the results. In particular, biological measures (i
punti scritti sopra) are good indicators on aquatic ecosystem health because they integrate
the effect of changes in many environmental factors.
AMOEBE approach à (General Method for Ecosystem Descriptions and Assessment) in this method,
different variables are chosen to evaluate an ecosystem. For each variable, there is a reference situation
(usually an undisturbed situation) where the values are 100%. The values of each variable in the actual/real
situation are expressed as a % of these reference values. Then all the values are plotted in a radar plot, the
reference situation is a perfect circle, while the values in the actual situation are different. The more
irregular the shape of the actual situation, the more it differs from the “ideal” reference situation (figura).
This difference can be used as an incentive to restore the reference situation, but in many cases, it is
impossible because in many of these studies, the reference situation is an historical situation which is not
realistic anymore.
Advantages AMOEBA à easy to use, very visual so it is easy to communicate the message.
Disadvantages AMOEBA à imprecise, based on subjective choice of variables and reference
situation, and does not five any spatial information.
Why use fish as indicator?
Advantages of using them:
- Fish are present in most aquatic systems, except very polluted ones.
- Fish are easy to identify, and most fishes can be returned to water after taking samples
- There is much information available about life-history and environmental response of fish
- Fish can exhibit external anatomical pathologies due to chemicals
- Fish exhibit physiological, morphological or behavioural responses to stress
- Fish are mobile and sensitive, so they tend to avoid stressful environments; this allows to measure
population patterns that reflect that stress
- Since fish range high distances, they can integrate diverse aspects of large-scale habitats
- Fish can live long, so they can provide a long-term record of environmental stress
, - Fish communities include species of different trophic levels (e.g. detritivores, herbivores, piscivores)
so effects of stress can be studied in all levels of the food web
- Fish contain many guilds and are able to integrate adverse effects on other components of the
ecosystem, e.g. habitat disturbance in a river catchment
- The public (e.g. consumers, people that do sport fishing) is likely to relate more directly to
information about fish than to other aquatic organisms.
Disadvantages:
- The sampling gears (reti per raccogliere samples) are selective for certain habitats and certain
sizes/species of fish
- Since fish move depending on seasonal or diet requirements, sampling bias can occur
- A large sampling effort is often needed
- Some fish species might be influenced by stocking, angling and commercial harvesting
- Fish can move away from areas where the disturbance of the ecosystem occurs, so they are not
exposed and the effect of the disturbance on fish cannot be studied
- Fish can be relatively tolerant for substances that are harmful for other organisms (so if you study
the effect of a substance, the fish might still feel good so you conclude that the situation is not bad
but it might be for other organisms)
- Environments that have been physically altered might still contain diverse fish assemblages
- Fish represent mainly the higher trophic levels (secondary and tertiary consumers), but lower level
organisms (primary consumers and producers, which are not used as indicators) might provide a
better indication of water quality problems.
Fish Indexes
Fish indexes are multi-metric = they use a range of measures or metrics that incorporate information from
individual, population and community level into a single index to determine water quality.
Steps to develop a fish index:
1. Selection of measures or metrics to include in the index. Metrics are factors that represent a
certain aspect of structure, function or other component of the fish community. Metrics are
divided into categories that refer to the richness of species, abundance of specific groups,
ecological functioning (food web, reproduction) and health. Vedi table 7.2 ecology notes
2. Evaluation of selected metrics. It is needed to make sure that they adequately measure the
ecological condition of the water body considered.
3. Development of reference condition. The reference condition is usually the optimal condition, and
it is needed to compare it to the real condition. It can be developed using historical records of how
the water body was in the past, expert input, or using predictive models.
4. Establishment of metric thresholds. These thresholds establish how much the metrics/measures
deviate from the reference situation. Metrics can be rated high, good, moderate, poor or bad. For
example, for the metric “total number of taxa” the moderate score is “<22 and >= 22”. The poor
score is “<12” and the high score is “>=22”. Vedi table 7.3 ecology notes.
5. Calculation and evaluation of index. The final Fish Index is calculated by adding up all values of the
metrics. In the example of table 7.3, there are 14 metrics in total and the moderate value is 3, so
the total moderate value is 14 x 3 = 42. Therefore, 40-44 can be considered the moderate score of
, the Fish Index. You then establish the score for the good, very good, poor and very poor class (table
7.4).
Characteristics of an optimal Fish Index:
- It has to be reproducible, so small differences in the sampling of the metrics do not result in large
difference in the total index score.
- Be responsive to environmental stress = it has to be sensitive enough to detect changes in the
ecosystem
- Be robust = not be too sensitive
- Reflect structural and functional characteristics of fish communities and integrate them
- Be simple and have metrics easy to measure
- Be an effective communication tool that can be easily understood.
Ecological habitat potentials for fish
If you want to restore the fish population in a certain water body, you have to investigate the potential of
the habitats to see if they would be suitable for that fish population to live. The habitat suitability is scored
with a Habitat Suitability Index (HSI) and is represented with a HSI model. The output of the model is a
score between 0 – not suitable and 1 – optimal habitat.
The first step to develop an HSI model is to describe the relationships between the values of the different
habitat variables (e.g. temperature, O2 dissolved in water, water pH, trophic status) and the relative
suitability for that species expressed between 0 and 1. For example for eels, a
temperature of 15°C has a suitability score of 0.4, or a pH of 6 has a score of 1
(optimal). (vedi table 7.5)
The next step is to link the variables to each other, and this can be done in 3
ways:
- Taking the arithmetic mean. It is used if different variables can
compensate each other, e.g. the temperature has a low suitability score
but the pH has a high score so they compensate.
- Taking the geometric mean. It can be used as well to compensate
variables, but if one variable has a score 0, the final result will be also 0
(this does not happen with the arithmetic mean).
- Taking the minimum value. It is done if there are strong limiting factor
relationships.
Also the spatial dimension can be included in an HSI model, with the Habitat
Evaluation Procedures (HEP). In a HEP, the habitat quality (HSI) is multiplied by the habitat quantity (area),
and it results in a value for the amount of “suitable habitat” in the area. In the picture, the red squares have
an HSI score of 1 – optimal habitat; it means that those areas of the habitat are optimal for the fish species
we want to introduce, while other parts are less suitable.
HEPs are used to:
- Compare quantity and quality of habitats in different study areas at the same time.
- Monitor the quantity and quality of habitats through time.
- Make scenario studies to predict future developments of that water body/habitat.
, Fish, water and multiple stakeholders
Stakeholders involved in aquaculture and fishery are commercial fishers, traditional fishers, recreational
fishers, environmentalists, tourism companies, water authorities, agriculture, governments and general
public. Each of these stakeholders has conflicts of interest with other stakeholders. For example,
commercial and traditional fishers have a conflict with environmentalists in terms of concerns about
overfishing caused by fishers.
Multicriteria analysis
Multicriteria analysis (MCA) is a decision-making tool used to compare and evaluate alternative scenarios
related to the management of water bodies (e.g. there is a water quality problem in a lake; the MCA
evaluates different possible management strategies/scenarios to determine what is the best).
Steps in MCA:
1. Definition of the different possible management scenarios.
2. Definition of the criteria to consider to evaluate the different management strategies. Criteria often
refer to water quality (e.g. transparency, total P), fish (e.g. type of fish community present, total
fish yield), vegetation (e.g. water plant cover) and values for stakeholders. (vedi table 8.2 esempio)
3. Analysis of the impacts of the management scenarios.
4. Overall judgment of the effects of scenarios, by evaluating the impacts.
The good thing about MCA is that it includes the stakeholders and their interests.
TUTORIAL ECOLOGY
The aim of the tutorial is to study the development of water quality and fish community in Lake Volkerak,
and study possible management options to improve water quality.
Lake Volkerak was created in 1987 by closing its access to sea. This caused all marine and brackish-water
fish to disappear because there was a change from salt water to fresh water. Then 3 phases of
development:
1. 1987-1990 no fish, so zooplankton became very abundant (because it was not eaten by fish) so
water was very clear because zooplankton ate algae.
2. 1990-1996 benthivorous fishes (=that eat organisms on the bottom) increased; to find food, they
have to raise the bottom so it increased turbidity. From 1994, also blooms of Cyanobacteria (blue-
green algae) started occurring in summer. Water plants started to decrease because of more algae.
3. 1996 onwards P concentration and Cyanobacteria increased more. Turbidity increased and the
population of benthivorous fish increased, while piscivorous fish did not increase.
Nowadays people living near the lake complain about the bad smell of rotting Cyanobacteria, and water is
also unsuitable for swimming, agriculture and there is mass death of water birds. Commercial fisherman
cannot sustain themselves with fishing in this lake, and also recreational fishermen are not satisfied.
Feedback loop that brings a clear and vegetated state When there is much vegetation, plants will use
much N and P, preventing mass growth of algae. Because of the small biomass of algae the water will stay
transparent, which assures the light penetration into the water, reinforcing the growth of vegetation.
Feedback loop that bring a turbid, algae-dominated state When there is high biomass of algae,
transparency will be low, so that waterplants cannot grow. Therefore zooplankton will not find shelter in