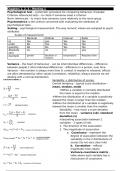
This is a summary of everything you need to know for the Psychometrics exam in 2024. It covers all theories of the Furr chapter from chapters 3 to 11. Plus, it has an explanation for every formula on the formula sheet. Also thorough steps on how to do the most important calculation and how to inter...
Week 2 Psychometrie - Literatuur en College aantekeningen
Week 2 Psychometrie - Literatuur en College
Week 1 Psychometrie - College en literatuur
All for this textbook (9)
Written for
Erasmus Universiteit Rotterdam (EUR)
Psychologie
2.3.1C Psychometrics: An Introduction
All documents for this subject (1)
Seller
Follow
veralains
Reviews received
Content preview
Chapters 1, 2, 3 – Meeting 1
Psychological test – systematic procedure for comparing behaviour of people
Criterion referenced tests – to check if someone meet a criterion
Norm referenced – to check how someone score relatively to the norm group
Psychometrics is the science concerned with evaluating the attributes of
psychological tests.
Scaling – psychological measurement. The way numeric values are assigned to psych
attributes
Scales of measurement:
Nominal Ordinal Interval Ratio
id Yes yes Yes Yes
order No Yes Yes Yes
quantity No No Yes Yes
Absolute no no no yes
zero
example gender Bachelor or temperature Response time
masters
Variance – the heart of behaviour - can be interindividual differences – difference
between people // intra-individual differences – difference in a person, over time.
Variance – the number is always more than 0; context is needed to interpret; effects
are often denotated by other values (correlation, reliability); always assume we are
dealing with a normal distribution
Variability + distribution of scores:
Central tendency – typical score distribution –
mean, median, mode
When a variable is normally distributed
the mean is equal to the median
When the distribution of a variable is positively
skewed the mean is larger than the median.
When the distribution of a variable is negatively
skewed the mean is smaller than the median
Variability – how much a score deviates
from the mean – variance (s2); standard
deviation (s)
Interpreting association between 2
variables – 2 types of info:
1. The direction of the association
2. The magnitude of association
a. Covariance – represent the
degree of association between the
variability in the 2 distributions of
scores (its not very clear info)
b. Correlation – reflects
magnitude more clearly
Variance-covariance matrix –
table where each variable has a
row/column of covariance.
, Composite score – score made up of multiple scores. Done by
summing up all the cells of the variance-covariance matrix.
Ex: The composite score Xij is calculated by summing the scores of Xi
and Xj for each subject
BINARY ITEMS – only have 2 option, p or
q. px= x/n AND py= y/n
Interpreting test scores
When the distribution is normal Z
table/score
When it’s not frequency table +
continuity correction
Computing percentile ranks from raw
scores – p(x), where F(x) means
cumulative frequency and f(x) means
frequency
Making scores with a NORMAL distribution:
1. Compute percentile ranks from raw scores – p(x)
2. Convert percentile ranks into to z-scores
3. Convert z-scores into raw scores (with the DESIRED/given mean and
sd). By looking in the Z-table + using T = Z(Snew) + X new
- Raw scores – not normalized, just raw
- Z-score – standardized score, not normalized. Calculated using raw scores, so
the distribution is the same as the distribution of raw scores
- T-score – linear transformation of z-score. So, the shape will remain the same,
still not normalized
- T-norms – transformation of normalized scores. They are standard scores
calculated based in the assumption of a normal distribution
To understand the distribution of a sample, you can use either p-values or
percentile ranks - When we can safely assume that the distribution of the scores is
truly normal, then we can use p-values. However, if there is a reason to suspect that
the distribution is not normal in the population, then it is tricky to use p-values,
because they may lead to a percentage that differs too much from the appropriate
percentage not assuming a normal distribution of the scores (like percentile ranks).
Chapter 4, Meeting 2
A test score should reflect 1 attribute, through composite score that add up all the
questions that represent the attribute
Test dimensionality – what attributes the test has.
Unidimensional – conceptual homogeneity, each item is a part of the same
psych attribute
Multidimensional – more than 1
attribute
o Important if the dimensions
are correlated – 2 types,
depending on whether the
dimensions are correlated:
, Multidimensional test with uncorrelated dimensions – here no total
score is computed
High-order factors – multidimensional test with correlated
dimension: the response to each question is affected by factors. The
attribute that affects multiple questions is the higher-order factor
Factor analysis – to test dimensionality –to analysis the internal structure of the
test. How many factors do I have? + Which items fit which factor and how well do they
fit the factor?
1. EFA – Exploratory Fcator Analysis (EFA)
a. Total variance explained - correlation matrix that show the eigenvalues –
they show how many factors there are in
the questionnaire (the max is the number
of questions).
i. The sum of the eigenvalues is = the
number of items of the test.
ii. % of variance that is explained by a factor = eigenvalues/number of
items x 100. Ex – 2.893/6 x 100 = 48,203
b. How many factors do you have?
c. You can check using the eigenvalues:
i. Examining the relative size of the eigenvalues + trying to find a
point at which the variance is small
ii. If eigenvalue > 1, then it might be a dimension - least accurate
method
iii. Ex: there are 2 factors, because only the first 2 eigenvalues explain a lot
of variances
iv. Factor 1’s eigenvalue = 2,892 Factor’s 1 proportional eigenvalue =
2,892/ 6 = 0,482
d. Then look at the scatter plot, look and the dip point. Probably the best
method because it shows a clear difference.
e. Think about the theory – how many factors is the test SUPPOSED to have?
Because all the methods mentioned are data driven so they can be affect by
sample fluctuation.
f. With the results we decide if the test is uni (if all attributes are correlated) or
multidimensional (if 2 or more attributes are correlated)
Rotation – to understand which items explain which dimensions
2. If the scale is multidimensional – ROTATE the factors – 2 methods:
a. Orthogonal / Varimax – factors are not allowed to correlate (not good for social
science)
i. Factor matrix – for factors that are uncorrelated. It shows the
correlation with the factors.
b. Non-orthogonal / oblique – factors are
allowed to correlate (good to do after you know
how many dimensions would have)
i. (also comes with a factor matrix on SPSS)
The benefits of buying summaries with Stuvia:
Guaranteed quality through customer reviews
Stuvia customers have reviewed more than 700,000 summaries. This how you know that you are buying the best documents.
Quick and easy check-out
You can quickly pay through EFT, credit card or Stuvia-credit for the summaries. There is no membership needed.
Focus on what matters
Your fellow students write the study notes themselves, which is why the documents are always reliable and up-to-date. This ensures you quickly get to the core!
Frequently asked questions
What do I get when I buy this document?
You get a PDF, available immediately after your purchase. The purchased document is accessible anytime, anywhere and indefinitely through your profile.
Satisfaction guarantee: how does it work?
Our satisfaction guarantee ensures that you always find a study document that suits you well. You fill out a form, and our customer service team takes care of the rest.
Who am I buying this summary from?
Stuvia is a marketplace, so you are not buying this document from us, but from seller veralains. Stuvia facilitates payment to the seller.
Will I be stuck with a subscription?
No, you only buy this summary for R224,87. You're not tied to anything after your purchase.