YSS-20306 - Quantitative and Qualitative Research (YSS20306)
Institution
Wageningen University (WUR)
Book
Discovering Statistics Using IBM SPSS
Dit is een samenvatting van alle colleges van het vak Quantitative and Qualitative Research Techniques in the Social Sciences (YSS-20306). Het bevat de slides van Quantitative, aangevuld met wat er in de colleges is verteld. Deze samenvatting is geheel in het Engels. Er staan alleen wat losse begri...
The lectures are based on this book (references are made).
December 17, 2018
30
2018/2019
Summary
Subjects
yss
yss 20306
yss20306
lecture
college
colleges
lectures
quantitative
kwantitatief
ivo van der lans
summary
samenvatting
quantitative and qualitative research techniques in the social sciences
Connected book
Book Title:
Author(s):
Edition:
ISBN:
Edition:
More summaries for
Samenvatting SPSS
deze duidelijke verslag helpt je om te slagen voor je examen
Samenvatting Discovering Statistics Using IBM SPSS Statistics Field SPSS - Multivariate Data Analysis
All for this textbook (314)
Written for
Wageningen University (WUR)
Bedrijfs- en Consumentenwetenschappen
YSS-20306 - Quantitative and Qualitative Research (YSS20306)
All documents for this subject (4)
2
reviews
By: joppewijnberger • 1 year ago
By: elbrichschuurmans • 4 year ago
Seller
Follow
nicolest
Reviews received
Content preview
ÝSS-20306 Lecture summary
Quantitative
Lecture 1 – Simple Regression Analysis
29-10-2018
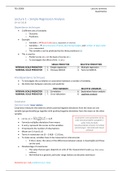
Dependence techniques
• 2 different sets of variables
o Outcome
o Predictors
• Example:
o Variable y → Record sales (a.k.a. dependent or criterion)
o Variables xj → attractiveness of band, advertising budget, and number of plays radio
(a.k.a. independent)
o The variable y can be predicted by the three predictors (xj)
• This is used to:
o Predict scores on y on the basis of scores on xj
o To investigate the effect of the xj’s on y
Interdependence techniques
• To investigate the correlation or association between a number of variables.
• No distinction between outcome and predictor
Covariance
Statistical model: linear relation
Covariance measures the extent to which positive/negative deviations from the mean on one
variable (proportionally) go together with positive/negative deviations from the mean on the other
variable.
∑𝑖(𝑥𝑖 −𝑢
̅)(𝑦𝑖 −𝑦̅) Covariantie is een parameter die bij
• 𝑐𝑜𝑣(𝑥, 𝑦) = 𝑁−1
= 4.25
twee toevalsvariabelen aangeeft in
• Formula multiplies deviations from means welke mate de beide
• Xi and yi represent the scores on the variables toevalsvariabelen (lineair) met elkaar
• N represents the number of observations samenhangen. (Veronderstelt lineair
verband)
• Means are 5.4 and 11.0
• Terms in numerator are (5 – 5.4)(8 – 11.0) etc.
• To make sense, variables have to be measured on interval-scale
o If this is done, the ratios of the differences between values is meaningful and these
can be used.
• Disadvantage of covariances
o The value that you get, depends on units of the measurement scale (e.g., litres versus
millilitres)
o Not limited to a general, particular range (values can become enormous)
Outcome (y) = red, predictors (xj) = blue
,ÝSS-20306 Lecture summary
Quantitative
Pearson correlation
• Forms a solution to the problem mentioned above, because the values will always fall
between 0 and |1|
• Divides covariance by product of standard deviations → Pearson correlation
𝑐𝑜𝑣(𝑥,𝑦)
o 𝑟(𝑥, 𝑦) = 𝑠𝑥 𝑠𝑦
= 0.87
• Measures linear relationship, so … (at least) interval-scaled variables
o With ordinal data use Spearman’s rho, Kendall’s tau, biserial, point-biserial
• Does not depend on units of the measurement scale
Correlation
Measure of linear relationship
r = 1 assumes perfect linear relation
r = .999 → Positive relation, slope ≈ 1
r = -.999 → Negative relation, slope ≈ -1
r = .763 → Smaller correlation
r = .809 → Not linearly correlated
r = .354 → Increasing ‘mess’
r = .056 → Not even slightly correlated
Statistical inference Fisher Z-transformatie is
• Null hypothesis significance testing (NHST) (are two-tailed!!) een manier om de
o Test H0: r = rhyphotesized versus H1: r ≠ rhypothesized verdeling van Pearson te
1 1+𝑟 veranderen zodat deze
o Fisher z transformation: zr = 2 √𝑁 − 3 ln (1−𝑟) = 1.87
normaal verdeeld wordt.
o Test H0: r = 0 versus H1: r ≠ 0
𝑟 √𝑁−2
o 𝑡𝑟 = = 3.07 N – 2 are degrees of freedom
√1−𝑟 2
• Assumptions that need to be met
o Independent observations
o Variables normally distributed (to make sure that the p-value is correct)
o Assumptions necessary for applicability of theoretical distributions, i.e. validity of p-
value
o Sample obtained by simple random sampling (all have the same chance to enter the sample)
• Also possible to create (e.g. 95%) confidence intervals
o If we draw same-sized samples over and over again, 95% of the correlations will be in
this interval
Outcome (y) = red, predictors (xj) = blue
,ÝSS-20306 Lecture summary
Quantitative
Measure of relationship
Correlation
• Effect size r2
• Field (citing Cohen, 1988, 1992) Others (citing Cohen, 1988, 1992)
0.01 is small 0.01 is small
0.09 is medium 0.06 is medium
0.25 is large 0.14 is large
• Also called coefficient of determination (proportion of variance accounted for)
Dependence
Simple regression
• Goal and diagram
• Predict outcome variable (criterion/dependent) y from predictor variable x (independent)
• Investigate effect of x on y
Adverts Packets
watched bought
Simple regression Interesting
Model Typically uninteresting
• Regression equation Error/residual
yi = f(xi) = (b0 + b1x1) + εi
= model + error/residual
Regression weights/coefficients
B0 (intercept)
B1 (slope)
Estimated such that variance (εi) is as small as possible
(method of least squares) →
Estimates: b̂0 and b̂1
Predicted scores: ŷi = b̂0 + b̂1xi
𝑐𝑜𝑣(𝑥,𝑦)
• b̂1 will be 𝑣𝑎𝑟(𝑥)
o Best (smallest variance)
Linear
Unbiased (expectation is equal to true b1 in the population)
Estimator (BLUE)
o If (assumption) εi = independent, identically distributed N(0,σ)
• Based on measure of linear relationship, so … assumes, (at least) interval-scaled outcome
and predictor variables
• Assumption of normally distributed residuals also requires (at least) interval-scaled outcome
variables
• Overall statistics: r(y, ŷ) = R = (multiple) correlation coefficient
• R2 = coefficient of determination
Outcome (y) = red, predictors (xj) = blue
, ÝSS-20306 Lecture summary
Quantitative
Overall statistics & SPSS
Test H0: R = 0 versus H1: R ≠ 0
Detailed statistics
Extra: t-test by simple regression: dummy variable
T-test: test of the average in the first group differs from the average from the second group
Assumptions
• Homogene variances (variance in the first group is about as big as variance in the second group)
• The larger the sample, the smaller the significant coefficients will be (so, pay attention to scale)
Outcome (y) = red, predictors (xj) = blue
The benefits of buying summaries with Stuvia:
Guaranteed quality through customer reviews
Stuvia customers have reviewed more than 700,000 summaries. This how you know that you are buying the best documents.
Quick and easy check-out
You can quickly pay through EFT, credit card or Stuvia-credit for the summaries. There is no membership needed.
Focus on what matters
Your fellow students write the study notes themselves, which is why the documents are always reliable and up-to-date. This ensures you quickly get to the core!
Frequently asked questions
What do I get when I buy this document?
You get a PDF, available immediately after your purchase. The purchased document is accessible anytime, anywhere and indefinitely through your profile.
Satisfaction guarantee: how does it work?
Our satisfaction guarantee ensures that you always find a study document that suits you well. You fill out a form, and our customer service team takes care of the rest.
Who am I buying this summary from?
Stuvia is a marketplace, so you are not buying this document from us, but from seller nicolest. Stuvia facilitates payment to the seller.
Will I be stuck with a subscription?
No, you only buy this summary for R88,40. You're not tied to anything after your purchase.