100% satisfaction guarantee Immediately available after payment Both online and in PDF No strings attached
logo-home
Summary Financial Management 214: Chapter 3: Analysis of financial statements R50,00
Add to cart

Summary

Summary Financial Management 214: Chapter 3: Analysis of financial statements

 62 views  1 purchase

In depth summary of Chapter 3 for financial management 214 which covers the analysis of financial statements.

Preview 2 out of 13  pages

  • May 4, 2020
  • 13
  • 2019/2020
  • Summary
All documents for this subject (8)
avatar-seller
grobbelaartara
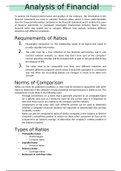
Analysis of Financial
Statements
To analyse the financial performance and position of the company, the information in the
financial statements are used to calculate financial ratios, which is more understandable
than the financial information contained in the financial statement and it enables the users
of financial statements to investigate meaningful relationships between figures. These
financial ratios also enable you to compare different time periods, between different
industries and different companies.


Requirements of Ratios
1. Meaningful comparison i.e. the relationship needs to be logical and needs to
provide valuable information.
2. The ratio must be a true reflection of the financial performance and it only
contains relevant amounts i.e. items that don’t form part of the company’s
normal operating activities will be excluded such as gain or loss generated during
the disposal of PPE.
3. The ratios need to be comparable over time, over different industries and
between different companies which means it should be calculated in a consistent
way and when any accounting policies are changed, it needs to be taken into
account.


Norms of Comparison
Ratios can never be analysed in isolation i.e. they must be viewed in conjunction with other
ratios to determine if the company’s financial position and performance is viable or not. The
comparisons can be done in the following ways:
- Through conventions i.e. a norm that is generally assumed as an acceptable figure
for a specific ratio such as 2 being the norm for the current ratio. It is important to
note that these norms are relative to the company and the industry.
- Comparisons of the same ratio over different periods can be used to determine
whether a company’s financial situation has improved or deteriorated and can help
to identify records.
- Ratios can also be compared to ratios of similar companies in the industry to find the
company’s competitive position in relation to these other companies or they can be
compared to an industry average, to determine the company’s relative position in
the industry (market).


Types of Ratios
• Profitability Ratios
• Profit margins
• Turnover ratios
• Liquidity Ratios
• Turnover times
• Solvency Ratios
• Coverage ratios
• Statement of cash flow ratios

, • Investment Ratios
NB – always look at additional information
*See textbook for answers


Profitability Ratios
DEFINITION: refers to the efficiency with which an enterprise utilises its capital to generate income.
We calculate the return on different capital items (needs to be a meaningful comparison). The higher
the return on an item, the more efficiently the company utilized that capital item.

RETURN ON Broader Sense Narrower Sense
TOTAL ASSETS It measures how efficiently the total Only assets (i.e. income generated by these
assets/capital of the enterprise is utilized to assets) utilized in the enterprise are taken
generate income. Operating profit and into consideration.
investment income are the income
generated from the company’s total assets.


= 35.79%
It gives management an indication of the
efficiency with which they managed the
= 32.08% assets under their control
The higher the return, the more efficient
total assets were utilized. Increase indicates
improvement in efficiency. To improve RoA
(or any other profitability ratio), the
company needs to improve income figure,
reduce amount of assets or achieve a combo
of the 2 (decreasing assets too much can be
detrimental and decrease profitability).
RETURN ON Equity = ordinary share capital + preference shares + non-controlling interest. It includes
EQUITY (Re) capital contributed by the owners (the bigger it is the safer it is for outsiders to provide debt
capital).


= 43.92%
RETURN ON Indicates the return generated on the shareholders’ equity invested in the company.
SHAREHOLDERS’ Provides important contribution to the financial valuation of the company since shareholder
EQUITY (Ra) value maximization is the goal. It compares attributable earnings to capital they invested in
the firm. Non-controlling interest is after tax amount thus we need to convert it to a before-
tax amount.


= 47.59%

The benefits of buying summaries with Stuvia:

Guaranteed quality through customer reviews

Guaranteed quality through customer reviews

Stuvia customers have reviewed more than 700,000 summaries. This how you know that you are buying the best documents.

Quick and easy check-out

Quick and easy check-out

You can quickly pay through EFT, credit card or Stuvia-credit for the summaries. There is no membership needed.

Focus on what matters

Focus on what matters

Your fellow students write the study notes themselves, which is why the documents are always reliable and up-to-date. This ensures you quickly get to the core!

Frequently asked questions

What do I get when I buy this document?

You get a PDF, available immediately after your purchase. The purchased document is accessible anytime, anywhere and indefinitely through your profile.

Satisfaction guarantee: how does it work?

Our satisfaction guarantee ensures that you always find a study document that suits you well. You fill out a form, and our customer service team takes care of the rest.

Who am I buying this summary from?

Stuvia is a marketplace, so you are not buying this document from us, but from seller grobbelaartara. Stuvia facilitates payment to the seller.

Will I be stuck with a subscription?

No, you only buy this summary for R50,00. You're not tied to anything after your purchase.

Can Stuvia be trusted?

4.6 stars on Google & Trustpilot (+1000 reviews)

53068 documents were sold in the last 30 days

Founded in 2010, the go-to place to buy summaries for 14 years now

Start selling
R50,00  1x  sold
  • (0)
Add to cart
Added